. 2025 Sep 25;16(1):8406.
doi: 10.1038/s41467-025-63410-5.

Cryo-EM structure of the full-length LGR4-RSPOs complex and a targeting nanobody for anti-obesity therapy

Affiliations

Cryo-EM structure of the full-length LGR4-RSPOs complex and a targeting nanobody for anti-obesity therapy

Zhongyun Zhang et al. Nat Commun. .

Abstract

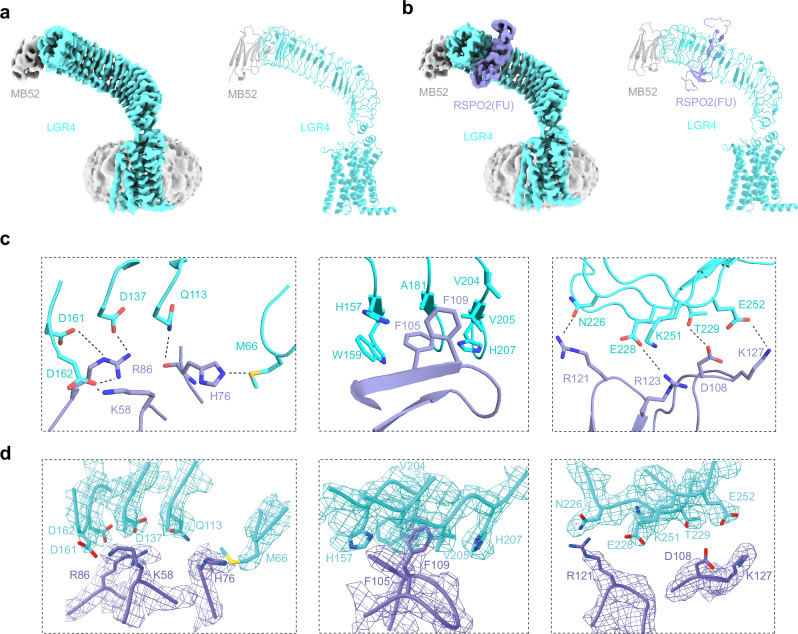
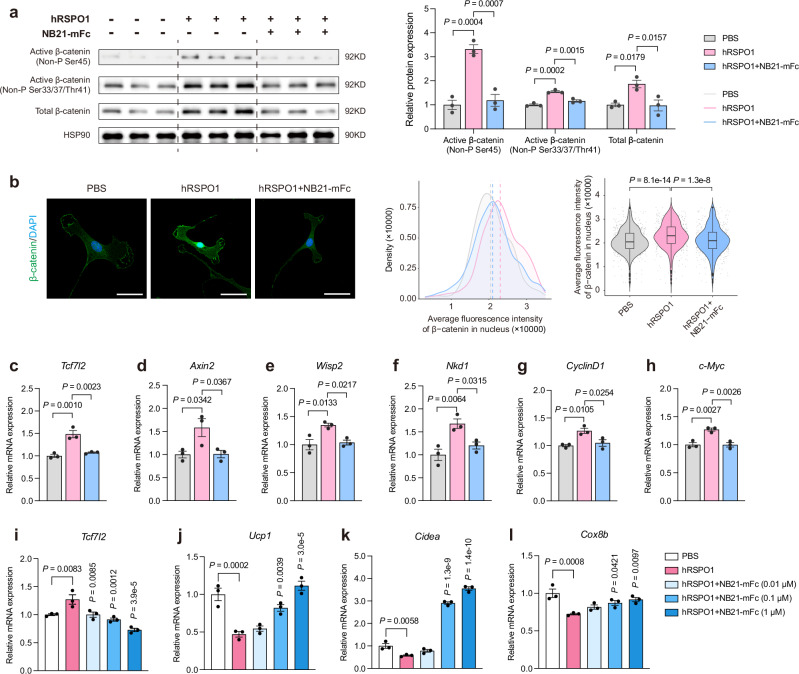
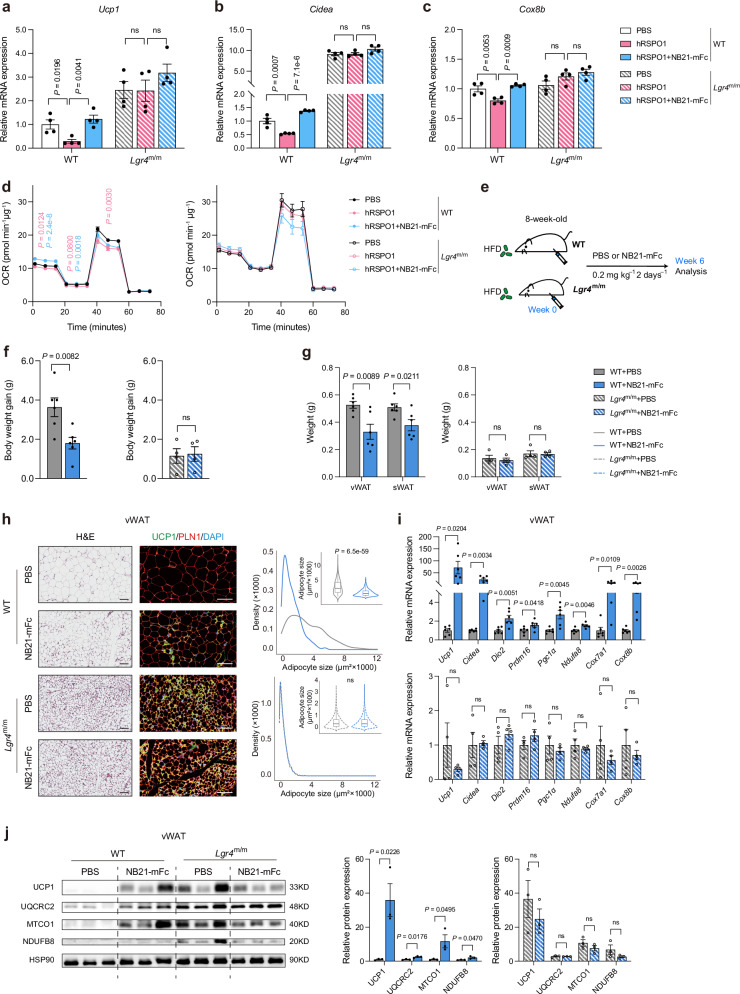
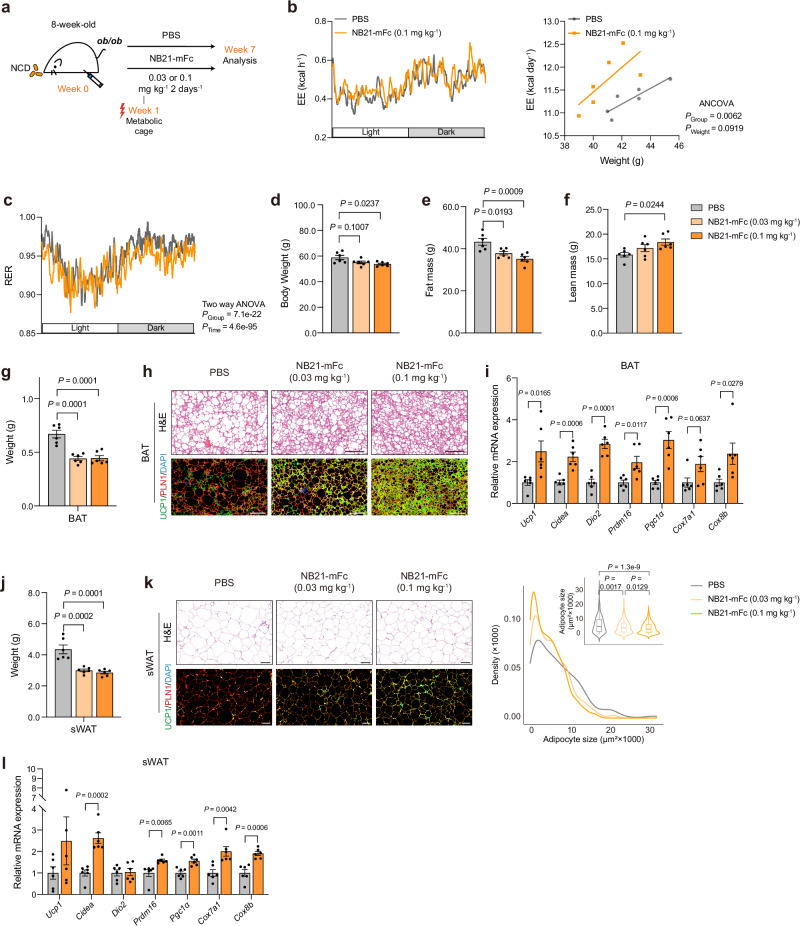
Obesity poses a substantial threat to human health but lacks effective management. Recent advancements in large-scale deep sequencing and cryo-electron microscopy (cryo-EM) have transformed drug discovery paradigms. Leveraging prior genetics investigation, we pinpointed Leucine-rich repeat-containing G protein-coupled receptor 4 (LGR4) as a promising target for combating obesity. Here, we present cryo-EM structures of full-length LGR4 alone and in complex with RSPO2(FU). Notably, we develop an inhibitory nanobody (NB21) that blocks the binding of RSPO1/2 to LGR4, and we also determine the structure of the LGR4-NB21 complex. NB21-mFc (NB21 fused with mouse IgG2) effectively inhibits the canonical Wnt signaling pathway, thereby enhancing mitochondrial respiration and thermogenesis in beige adipocytes. In vivo, NB21-mFc increases energy expenditure by promoting the browning of white fat, conferring resistance to both diet-induced and genetic (ob/ob) obesity. Furthermore, LGR4 deficiency abolishes the effects of NB21-mFc in boosting the browning program and subsequent weight reduction. In summary, our study unveils structural insights into the LGR4-RSPOs and LGR4-NB21 complexes, paving the way for the development of an LGR4-targeting nanobody for weight loss.


Conflict of interest statement

Competing interests: J.W. and G.N. are listed as inventors on a patent application entitled “LGR4-targeting nanobody NB21 and use thereof in anti-obesity treatment” (PCT/CN2025/076673; CN120058937), filed by Ruijin Hospital, Shanghai Jiao Tong University School of Medicine. The patent covers the NB21 antibody and its therapeutic use in obesity. The remaining authors declare no competing interests.

Figures

Fig. 1
Fig. 1. Cryo-EM structures of LGR4 alone and in complex with RSPO2(FU).
a Structure of the LGR4-MB52 complex. The cryo-EM map contoured at 0.157 (13.7σ) (left) and atomic model (right) are shown. b Structure of the MB52-LGR4-RSPO2(FU) complex. The cryo-EM map contoured at 0.153 (7.87σ) (left) and atomic model (right) are shown. c Interface between LGR4 and RSPO2(FU). d The cryo-EM densities for the interaction interfaces between LGR4 and RSPO2(FU) contoured at 0.153 (7.87σ). Interacting residues are drawn as sticks. LGR4 cyan, RSPO2(FU) purple, MB52 gray. The same color scheme is used throughout the manuscript unless stated otherwise.
Fig. 2
Fig. 2. Cryo-EM structure and analysis of LGR4-NB21 complex.
a Structure of the MB52-LGR4-NB21 complex. The cryo-EM map contoured at 0.136 (12.2σ) (left) and the atomic model (right) are shown. b Interface between LGR4 and NB21. c The cryo-EM densities for the interaction interfaces between LGR4 and NB21 contoured at 0.136 (12.2σ). d Superposition of LGR4(ECD) in LGR4-RSPO2(FU) complex and LGR4-NB21 complex. Interacting residues are drawn as sticks. LGR4 cyan, NB21 pink, MB52 gray, RSPO2(FU) purple. The same color scheme is used throughout the manuscript unless stated otherwise.
Fig. 3
Fig. 3. NB21-mFc suppresses canonical Wnt/β-catenin signaling pathway and promotes a white-to-brown adipocyte switch in vitro.
ah The SVFs derived from sWAT of C57BL/6 J mice treated with hRSPO1 (0.1 μg mL−1) alone or in addition to NB21-mFc (0.1 μM) for 48 h. a Immunoblot analysis (left) and quantification (right) of active (non-phosphorylated) and total β-catenin (n = 3 independent cell cultures per group). HSP90 was used as an internal control. b Representative images (left) of immunofluorescence staining of β-catenin and quantitative analysis (middle and right) of average fluorescence intensity of β-catenin in the nucleus. Analysis was performed on individual cells from randomly selected fields (n = 598 for PBS, n = 458 for hRSPO1, and n = 456 for hRSPO1 + NB21-mFc). Scale bar, 50 μm. ch qPCR analysis of the downstream genes of canonical Wnt signaling pathway, including Tcf7l2 (c), Axin2 (d), Wisp2 (e), Nkd1 (f), CyclinD1 (g), and c-Myc (h) (n = 3 independent cell cultures per group). il qPCR analysis of Tcf7l2 (i) and thermogenic genes, including Ucp1 (j), Cidea (k), and Cox8b (l), in induced beige adipocytes pre-treated with hRSPO1 (0.1 μg mL−1) alone or in addition to different concentrations of NB21-mFc (0.01, 0.1, and 1.0 μM) from day -2–2 (n = 3 independent cell cultures per group). For a, cl, values are presented as mean ± SEM. Kernel density plot (b, middle) shows the data distribution with the central line indicating the median; violin plot overlaid with box plot (b, right) show the median (center line), the 25th and 75th percentiles (box bounds), and whiskers extending to 1.5× IQR. Statistical analysis was performed using one-way ANOVA followed by Dunnett’s multiple-comparison test (a, cl), and Kruskal–Wallis test followed by Bonferroni–Dunn test (b). SVFs stromal vascular fractions, sWAT subcutaneous white adipose tissue, qPCR quantitative PCR, IQR interquartile range, ANOVA analysis of variance. Source data are provided as a Source Data file.
Fig. 4
Fig. 4. NB21-mFc enhances energy expenditure and thermogenesis under cold stress.
ae 8-week-old female C57BL/6 J mice fed HFD were treated by intraperitoneal injection with PBS or NB21-mFc (0.2 mg kg−1) once daily (n = 8 mice per group). a Schematic diagram of treatment. b, c 24 h EE trace (b, left) and normalized EE with body weight as covariant (b, right), 24 h RER (c) in room temperature (22 °C) at day 7. d After the abovementioned experiments, EE of mice in (a) before and after acute cold exposure (5 °C) were recorded. The values under cold were calculated between 3–4 h. e After 21 days of treatment, body core temperature changes after 6 h cold exposure (5 °C). fl 8-week-old female C57BL/6 J mice fed HFD were treated by intraperitoneal injection with PBS or NB21-mFc (0.2 mg kg−1) once daily under chronic cold stimulation (5 °C) for 7 days (n = 6 mice per group). f Schematic diagram of treatment. g, j Representative images of H&E staining, immunofluorescence staining of UCP1/Perilipin, and quantification of adipocyte area in vWAT (g) and sWAT (j). Scale bar, 100 μm. h, k qPCR analysis of thermogenic and mitochondrial respiratory complex genes in vWAT (h) and sWAT (k). i, l Immunoblot analysis and quantification of UCP1 and mitochondrial respiratory complexes in vWAT (i) and sWAT (l). For be, h, i, k, l, values are presented as mean ± SEM. Kernel density plot (g, j) shows the data distribution; violin plots overlaid with box plots (g, j) show the median (center line), the 25th and 75th percentiles (box bounds), and whiskers extending to 1.5× IQR. Statistical analysis was performed using two-sided ANCOVA (b), two-way ANOVA (ce), two-sided Wilcoxon rank-sum test (g, j), and unpaired two-tailed Student’s t test (h, i, k, l). HFD high-fat diet, EE energy expenditure, RER respiratory exchange ratio, vWAT visceral white adipose tissue, sWAT subcutaneous white adipose tissue, qPCR quantitative PCR, H&E hematoxylin-eosin, IQR interquartile range, ANCOVA analysis of covariance, ANOVA analysis of variance. Source data are provided as a Source Data file.
Fig. 5
Fig. 5. NB21-mFc promotes a browning program in an LGR4-dependent manner.
ad Induced beige adipocytes derived from WT and littermate Lgr4m/m mice treated with hRSPO1 (0.1 μg mL−1) alone or in addition to NB21-mFc (0.1 μM) from day −2–2. ac qPCR analysis of Ucp1 (a), Cidea (b), and Cox8b (c) (n = 4 independent cell cultures per group). d OCR measurement (n = 8 independent cell cultures per group). ej 8-week-old female WT and Lgr4m/m mice fed HFD were treated by intraperitoneal injection with PBS or NB21-mFc (0.2 mg kg−1) every other day for 6 weeks (n = 6 mice per group for WT, and n = 4 mice per group for Lgr4m/m). e Schematic diagram of treatment. f, g Body weight gain (f) and tissue weight of vWAT and sWAT (g) of two genotypes after 6-week treatment. h Representative images of H&E staining, immunofluorescence staining of UCP1/Perilipin, and quantification of adipocyte area in vWAT. Scale bar, 100 μm. i qPCR analysis of thermogenic and mitochondrial respiratory complex genes in vWAT. j Immunoblot analysis (left) and quantification (right) of UCP1 and mitochondrial respiratory complexes in vWAT. For ad, f, g, i, j, values are presented as mean ± SEM. Kernel density plot (h) shows the data distribution; violin plots overlaid with box plots (h) show the median (center line), the 25th and 75th percentiles (box bounds), and whiskers extending to 1.5× IQR. Statistical analysis was performed using one-way ANOVA followed by Dunnett’s multiple-comparison test (ad), unpaired two-tailed Student’s t test (f, g, i, j), and two-sided Wilcoxon rank-sum test (h). ns not significant, WT wild-type, OCR oxygen consumption rate, HFD high-fat diet, H&E hematoxylin-eosin, vWAT visceral white adipose tissue, sWAT subcutaneous white adipose tissue, qPCR quantitative PCR, IQR interquartile range, ANOVA analysis of variance. Source data are provided as a Source Data file.
Fig. 6
Fig. 6. Anti-obesity effects of NB21-mFc in ob/ob mice.
8-week-old male ob/ob mice fed NCD were treated by intraperitoneal injection with PBS or NB21-mFc (0.03 mg kg−1 or 0.1 mg kg−1) every other day for 7 weeks (n = 6 mice per group). a Schematic diagram of treatment. b, c 24 h EE trace (b, left) and normalized EE with body weight as covariant (b, right), 24 h RER (c) in room temperature (22 °C) at day 7. df Body weight (d), fat mass (e), and lean mass (f) after 7-week treatment. g, j Tissue weight of BAT (g) and sWAT (j). h Representative images of H&E staining and immunofluorescence staining of UCP1/Perilipin in BAT. Scale bar, 100 μm. i, l qPCR analysis of thermogenic and mitochondrial respiratory complex genes in BAT (i) and sWAT (l). k Representative images of H&E staining, immunofluorescence staining of UCP1/Perilipin, and quantification of adipocyte area in sWAT. Scale bar, 100 μm. For bg, i, j, l, values are presented as mean ± SEM. Kernel density plot (k) shows the data distribution; violin plots overlaid with box plots (k) show the median (center line), the 25th and 75th percentiles (box bounds), and whiskers extending to 1.5× IQR. Statistical analysis was performed using two-sided ANCOVA (b), two-way ANOVA (c), one-way ANOVA followed by Tukey’s multiple-comparison test (dg, j), unpaired two-tailed Student’s t test (i, l), and Kruskal-Wallis test followed by Bonferroni–Dunn test (k). NCD, normal chow diet, EE energy expenditure, RER respiratory exchange ratio, BAT brown adipose tissue, sWAT subcutaneous white adipose tissue, qPCR quantitative PCR, H&E hematoxylin-eosin, IQR interquartile range, ANCOVA analysis of covariance, ANOVA analysis of variance. Source data are provided as a Source Data file.

References

    1. Bjerregaard, L. G. & Baker, J. L. Change in overweight from childhood to early adulthood and risk of type 2 diabetes. N. Engl. J. Med.378, 2537–2538 (2018). - PubMed
    1. Calle, E. E. Obesity and cancer. Bmj335, 1107–1108 (2007). - PMC - PubMed
    1. Calle, E. E., Rodriguez, C., Walker-Thurmond, K. & Thun, M. J. Overweight, obesity, and mortality from cancer in a prospectively studied cohort of U.S. adults. N. Engl. J. Med.348, 1625–1638 (2003). - PubMed
    1. Gregg, E. W. & Shaw, J. E. Global health effects of overweight and obesity. N. Engl. J. Med.377, 80–81 (2017). - PubMed
    1. Ng, M. et al. Global, regional, and national prevalence of overweight and obesity in children and adults during 1980−2013: a systematic analysis for the Global Burden of Disease Study 2013. Lancet384, 766–781 (2014). - PMC - PubMed

MeSH terms