. 2025 Sep 25;16(1):8192.
doi: 10.1038/s41467-025-62692-z.

The genetic diversity of Indonesian cattle has been shaped by multiple introductions and adaptive introgression

Affiliations

The genetic diversity of Indonesian cattle has been shaped by multiple introductions and adaptive introgression

Xi Wang et al. Nat Commun. .

Abstract

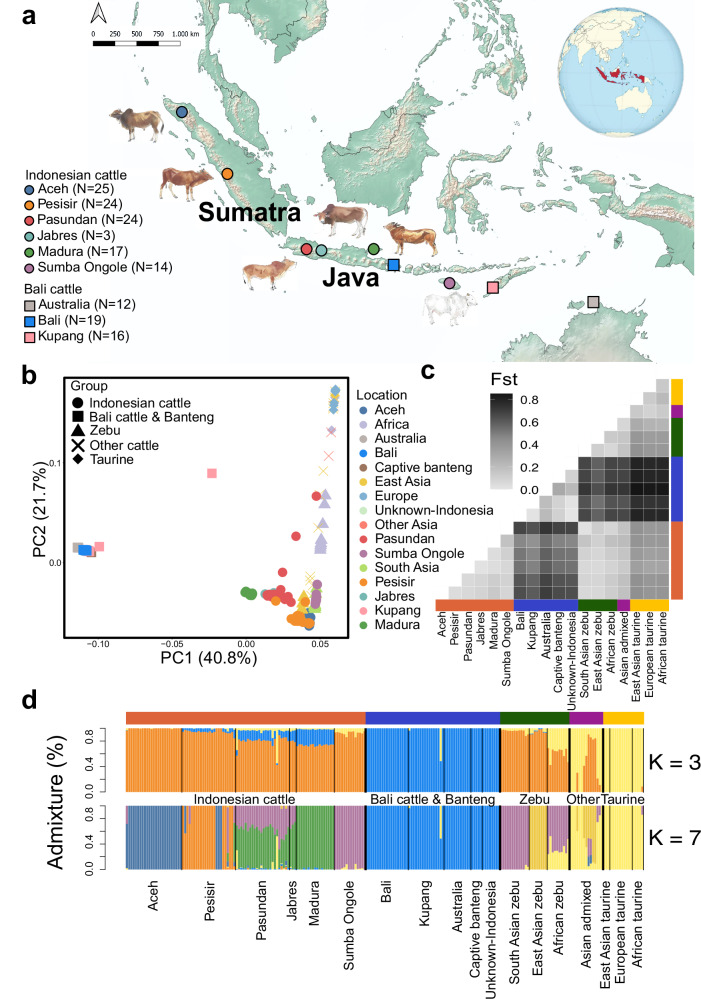
Genetic diversity is a crucial resource in livestock, determining their traits and ability to respond to selection. Indonesian cattle are unique due to their history of admixture involving both zebu (Bos indicus) and banteng (B. javanicus), and may therefore contain novel cattle genetic resources. We generated whole genome sequences from 126 Indonesian cattle, 51 domesticated banteng and three captive banteng. We show that Indonesian cattle have very high genetic diversity, especially the Madura breed due to introgression from banteng and possibly other Bos species, contributing up to 36.6% of the Madura's genome. We find that Indonesian zebu ancestry can be traced to at least three distinct ancestral populations, two of which were introduced more than 1345 years ago from mainland Southeast or eastern Asia. Peaks and valleys in banteng ancestry across the genome in admixed breeds suggest that both negative and positive selection act on introgressed haplotypes. Despite adaptive introgression being mainly breed-specific, we found evidence that some phenotypes, such as coat color, have experienced convergent adaptive introgression. Overall, our results provide insights into the historical movement of cattle in Asia, and showcase the potential for genetic improvement of cattle by identifying ~3.5 million novel SNPs introgressed into Indonesian cattle.


Conflict of interest statement

Competing interests: The authors declare no competing interests.

Figures

Fig. 1
Fig. 1. Sampling and population structure.
a Sampling locations of the sequenced Indonesian cattle and Bali cattle. b Visualization of 231 samples using two principal components based on genetic distance inferred by HaploNet. One individual (N_31B) had equal admixture from banteng and taurine cattle, referred to as the putative F1 hybrid. c Global genetic differentiation measured as FST values using Hudson’s estimator between all population pairs. d Individual ancestry proportions inferred by HaploNet for K = 3 and K = 7.
Fig. 2
Fig. 2. Genetic diversity and inbreeding.
a Heterozygosity of all Indonesian cattle and other cattle based on genotype data with non-variable sites included (See Methods). Boxplots indicate median (centre line), the 25th and 75th percentiles (box), and the highest and lowest values within the upper and lower quartiles ± 1.5* interquartile range, respectively (whiskers). b The total number of ROH segments (y axis) and the total length (Mb) of the genome in ROH (x axis) for all 231 samples. Each dot represents an individual. Sample sizes of the populations included in (a, b) are as follows: Aceh (n  =  25), Pesisir (n  = 24), Pasundan (n  =  24), Jabres (n  =  3), Madura (n  =  17), Sumba Ongole (n  =  14), Bali (n  =  19), Kupang (n  =  16), Australia (n  =  12), Captive banteng (n  =  5), Unknown-Indonesia (n  =  8), South Asian zebu (n  =  13), East Asian zebu (n  =  8), African zebu (n  =  10), Asian admixed (n  =  15), East Asian taurine (n  =  3), European taurine (n  =  10), and African taurine (n  =  5).
Fig. 3
Fig. 3. Population history and introgression.
a Population tree inferred with TreeMix assuming five migration events. We used a water buffalo as an outgroup. Arrows represent migration edges, with colour indicating the migration weight (proportion of the admixed population estimated to derive from the source population). b D-statistics calculated by ADMIXTOOLS2 when using water buffalo as outgroup H4, various cattle populations as H1/H2. Left panel: South Asian zebu and captive banteng as H2 and H3; right panel: captive banteng and South Asian zebu as H1 and H3. A significant non-zero value, as depicted by the red arrow in the graphic for each panel, provides evidence for gene flow between H3 and H1 (Left panel), and between H3 and H2 (Right panel). Data are presented as the estimated D-statistic ± 3 standard errors. Star represents significant allele sharing for each combination. Sample sizes for each population are as follows: Aceh (n  =  24), Pesisir (n  = 17), Pasundan (n  =  21), Jabres (n  =  3), Madura (n  =  17), Sumba Ongole (n  =  14), Bali (n  =  19), Kupang (n  =  14), Australia (n  =  12), Captive banteng (n  =  5), Unknown-Indonesia (n  =  8), South Asian zebu (n  =  11), East Asian zebu (n  =  8), African zebu (n  =  10), Asian admixed (n  =  15), East Asian taurine (n  =  3), European taurine (n  =  10), and African taurine (n  =  5). c Individual admixture proportion from LOTER and F4. We used unadmixed zebu and banteng as the two ancestry source references for LOTER. We used water buffalo and taurine as outgroups for the F4 ratio admixture inference.
Fig. 4
Fig. 4. Origin of introgressed fragments in Indonesian cattle.
a The mean ratio of SNPs shared with two outgroups, Javan banteng and gaur, in inferred introgressed regions of each admixed cattle population, based on Hmmix. b Pairwise identity by state matrix (mibs) calculated from overlapping archaic regions (probability > 0.9) between two individuals using a 10 Kb window size. Insert: neighbor-joining tree of the genetic distance (1-mibs) in pairwise overlapping archaic regions. c Inference of admixture time using AdmixtureHMM with one pulse model. Numbers shown are average generation times across 100 bootstraps. d Genome-wide heterozygosity in two admixed populations, Aceh (n  =  24) and Madura (n  =  17), when stratified by the three possible ancestry states: homozygous for zebu ancestry (“Zebu” on x-axis), homozygous for banteng ancestry (“Banteng”), heterozygous for zebu/banteng ancestry (“Mixed ancestry”) and finally across the whole genome (“All”). Results for all admixed populations and East Asian zebu are in Supplementary Fig. 14. Boxplots indicate median (centre line), the 25th and 75th percentiles (box), and the highest and lowest values within the upper and lower quartiles ± 1.5* interquartile range, respectively (whiskers). e PCA analysis on genome segments of banteng ancestry origin and zebu ancestry origin respectively, as inferred by LOTER. To remove any distant relatedness among samples, we removed one of each pair of individuals with K1 > 0.2 identified by ngsRelate for (b, d) (Supplementary Fig. 31).
Fig. 5
Fig. 5. Ancestry landscape of Indonesia cattle.
a Banteng ancestry across chromosome 13 in five cattle groups (Aceh, East Asian zebu, Madura, Pasundan, and Pesisir). Window-based scan of regions with extreme banteng ancestry using the proportion of inferred banteng SNPs from LOTER for each cattle group divided by the mean proportion per group. Pink shade marks regions in the genome-wide top 5% of the normalized LOTER summed across all groups. Similar plots for other chromosomes are in Supplementary Fig. 19. b LOTER and Ux results across cattle groups, showing windows in ASIP (chr 13, 62700000–64250000) and KIT region (chr 6, 64900000–71100000). The windows containing the actual coding region of ASIP and KIT are highlighted with the gene name. c Spearman correlations of banteng proportion in all windows of 50 Kb. d Upset plot of genes within top 5% highest banteng proportion windows for five admixed groups (Aceh, Pesisir, Pasundan, Madura, East Asian zebu). The number in each bar represents the number of genes between different breed comparisons. e Word clouds of the QTL terms contained within the top 5% of LOTER inferred banteng ancestry for each group. We included only the top 5% of terms overlapping most frequently with regions of high banteng ancestry for each cattle group.

References

    1. Strandén, I., Kantanen, J., Lidauer, M. H., Mehtiö, T. & Negussie, E. Animal board invited review: Genomic-based improvement of cattle in response to climate change. Animal16, 100673 (2022). - PubMed
    1. Taberlet, P., Coissac, E., Pansu, J. & Pompanon, F. Conservation genetics of cattle, sheep, and goats. C. R. Biol.334, 247–254 (2011). - PubMed
    1. The State of the World’s Biodiversity for Food and Agriculture: FAO COMMISSION ON GENETIC RESOURCES FOR FOOD AND AGRICULTURE ASSESSMENTS •. Food and Agriculture Organization of the United Nations Food & Agriculture Org (2019).
    1. Chen, N. et al. Whole-genome resequencing reveals world-wide ancestry and adaptive introgression events of domesticated cattle in East Asia. Nat. Commun.9, 2337 (2018). - PMC - PubMed
    1. Chen, N. et al. Global genetic diversity, introgression, and evolutionary adaptation of indicine cattle revealed by whole genome sequencing. Nat. Commun.14, 7803 (2023). - PMC - PubMed

LinkOut - more resources