. 2025 Sep 25;16(1):8402.
doi: 10.1038/s41467-025-63465-4.

Oncogenic driver mutations underlie the spatial tumour immune landscape of non-small cell lung cancer

Affiliations

Oncogenic driver mutations underlie the spatial tumour immune landscape of non-small cell lung cancer

Saskia Hartner et al. Nat Commun. .

Abstract

Lung adenocarcinoma (LUAD) is a molecularly diverse form of lung cancer characterized by distinct oncogenic driver mutations that influence both tumour biology and clinical outcomes. Understanding the interplay between these oncogenic drivers and the tumour microenvironment (TME) is crucial for improving therapeutic strategies and patient management. Here, we investigate the impact of driver mutations on the composition and spatial architecture of the TME in LUAD. Using imaging mass cytometry (IMC), we analyse tumour samples from 157 LUAD patients, integrating genomic and clinical data to link specific mutations with tumour characteristics. Unique patterns are associated with mutated KRAS and EGFR tumours with TP53 co-mutations, suggesting these co-mutations reshape the TME and promote resistance to tyrosine kinase inhibitors (TKIs). Overall, our findings highlight the complex interplay between oncogenic driver mutations and the TME in LUAD, underscoring the importance of integrating genomic and cellular data to understand the underlying tumour behaviour and prognosis.


Conflict of interest statement

Competing interests: The authors declare no competing interests.

Figures
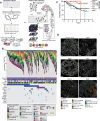
Fig. 1
Fig. 1. Clinical and genomic characteristics of LUAD patient cohort.
A Schematic illustrating the Oncomine NGS process applied to FFPE or snap-frozen samples from 157 LUAD patients, combined with IMC acquisition for multiplexed imaging and single-cell phenotyping. B Oncoplot depicting the clinical characteristics, tumour cellular composition, and mutation status of the 157 patients in the study cohort. C Kaplan-Meier survival probability across different oncogenic driver groups, Unknown driver (n = 40), KRAS (n = 71), EGFR (n = 26), MET (n = 9), PIK3CA (n = 8), BRAF (n = 3) mutations. Statistical analysis was performed using two-sided Logrank Mantel-Cox and Gehan-Breslow-Wilcoxon tests. d Representative images of antibody staining for different oncogenic driver groups performed on tumour cores of patient with Unknown driver (n = 40), KRAS (n = 71), EGFR (n = 26), MET (n = 9), PIK3CA (n = 8), BRAF (n = 3) mutations. Scale bars, 100 µm. Source data are provided as a source data file.
Fig. 2
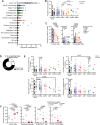
Fig. 2. The immunological landscape of LUAD is influenced by oncogenic driver alterations.
A Prevalence of 17 cell types, across 157 patients with LUAD as a proportion of total cells. B Prevalence of lymphoid and myeloid cells as a proportion of total cells across 6 oncogenic driver patient groups: Unknown driver (n = 40), KRAS (n = 71), EGFR (n = 26), MET (n = 9), PIK3CA (n = 8), BRAF (n = 3). Comparisons within individual oncogenic driver groups were performed using two-sided Wilcoxon tests, comparisons between oncogenic drivers were performed using two-sided Mann-Whitney tests. C Prevalence of indicated cell types as a proportion of total cells across 6 oncogenic driver patient groups, Unknown driver (n = 40), KRAS (n = 71), EGFR (n = 26), MET (n = 9), PIK3CA (n = 8), BRAF (n = 3). Two-sided Mann-Whitney tests were used for statistical analysis. D Pie chart depicting the proportion of unclassified cells that are CD45+ across 157 LUAD patients. E Prevalence of lymphoid, myeloid, cancer and endothelial cells as a proportion of total cells across 6 oncogenic driver patient groups stratified by sex: Unknown driver male (n = 23), Unknown driver female (n = 17), KRAS male (n = 20), KRAS female (n = 51), EGFR male (n = 8), EGFR female (n = 18), MET male (n = 7), MET female (n = 2), PIK3CA male (n = 4), PIK3CA female (n = 4), BRAF male (n = 2), BRAF female (n = 1). Comparisons between sex within individual oncogenic driver groups and between driver groups by sex were performed using a 2-way ANOVA. F Prevalence of indicated cell types as a proportion of total cells across 4 patient groups with different EGFR point mutations, p.E746_A750del (n = 7), p.G719A (n = 4), p.L858R (n = 9), Other (n = 6). Two-sided Mann-Whitney tests were used for statistical analysis. Source data are provided as a source data file.
Fig. 3
Fig. 3. TP53 co-mutations shape cell-cell interactions and avoidance patterns.
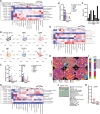
A Heatmap depicting significant pairwise cell–cell interaction (red) or avoidance (blue), grey boxes represent interaction or avoidance patterns with less than random chance by permutation-based proximity analysis, across samples from patients with an EGFR driver mutation (n = 19) compared to EGFR driver mutation with a TP53 co-mutation (n = 7). 50,000 permutations per image. Black boxes indicate associations referenced in the text. B Prevalence of cells as a proportion of total cells compared between patients with KRAS (n = 54) and KRAS with a TP53 co-mutation (n = 17). Two sided Mann-Whitney tests were used for statistical analysis. c Heatmap depicting significant pairwise cell–cell interaction (red) or avoidance (blue), grey boxes represent interaction or avoidance patterns with less than random chance, by permutation-based proximity analysis, across samples from patients with an KRAS driver mutation (n = 54) compared to KRAS driver mutation with a TP53 co-mutation (n = 17). 50,000 permutations per image. Black boxes depict associations referenced in the text. Source data are provided as a source data file.
Fig. 4
Fig. 4. KRAS and EGFR driver alterations are associated with distinct spatially resolved cellular neighbourhoods.
A Heatmap of 9 CNs discovered in 157 patients with LUAD calculated on 10 closest neighbouring cells. Log-rank test for survival. B Average distribution of CNs across patient groups: Unknown driver (n = 40), KRAS (71), EGFR (n = 26), MET (n = 9), PIK3CA (n = 8), BRAF (n = 3) discovered in (A). C Frequency of CN7 and CN8 as a percentage of all CNs in patient gropus: Unknown driver (n = 40), KRAS (71), EGFR (n = 26), MET (n = 9), PIK3CA (n = 8), BRAF (n = 3) discovered in (A). Two-sided Mann-Whitney tests were used for statistical analysis. D Heatmap of 9 BCNs discovered in 157 patients with LUAD calculated on 20 closest neighbouring cells. Log-rank test for survival. E Frequency of BCN8 as a percentage of all BCNs in patient groups: Unknown driver (n = 40), KRAS (71), EGFR (n = 26), MET (n = 9), PIK3CA (n = 8), BRAF (n = 3) discovered in (D). F Number of mast cells in BCNs discovered in (D). G Heatmap of 9 ECNs discovered in 26 patients with EGFR driver mutation. H Representative images of 9 cellular neighbourhoods in patients with EGFR (n = 19) or EGFR + TP53 (n = 7) co-mutations tumours discovered in (G) using Voronoi diagrams. I Average distribution of ECNs across patients with EGFR (n = 19) and EGFR TP53 (n = 7) discovered in (G). J Cell distribution within ECN5 discovered in (G). K Frequency of ECN5 in patients with EGFR (n = 19) and EGFR TP53 (n = 7) as a percentage of all ECNs discovered in (G). Two-sided Mann-Whitney test was used for statistical analysis. Source data are provided as a source data file.

References

    1. Collisson, E. A. et al. Comprehensive molecular profiling of lung adenocarcinoma. Nature511, 543–550 (2014). - PMC - PubMed
    1. Imyanitov, E. N., Iyevleva, A. G. & Levchenko, E. V. Molecular testing and targeted therapy for non-small cell lung cancer: Current status and perspectives. Crit. Rev. Oncol. /Hematol.157, 103194 (2021). - PubMed
    1. Del Re, M. et al. Concise review: resistance to Tyrosine Kinase inhibitors in non-small cell lung cancer: the role of cancer stem cells. Stem Cells36, 633–640 (2018). - PubMed
    1. Lim, S. M., Syn, N. L., Cho, B. C. & Soo, R. A. Acquired resistance to EGFR targeted therapy in non-small cell lung cancer: Mechanisms and therapeutic strategies. Cancer Treat. Rev.65, 1–10 (2018). - PubMed
    1. Wang, L., Jia, Q., Chu, Q. & Zhu, B. Targeting tumor microenvironment for non-small cell lung cancer immunotherapy. Chin. Med. J. Pulm. Crit. Care Med.1, 18–29 (2023). - PMC - PubMed

MeSH terms