. 2025 Sep 25;16(1):8428.
doi: 10.1038/s41467-025-63976-0.

Molecular basis of ParA ATPase activation by the CTPase ParB during bacterial chromosome segregation

Affiliations

Molecular basis of ParA ATPase activation by the CTPase ParB during bacterial chromosome segregation

Lucas Schnabel et al. Nat Commun. .

Abstract

DNA segregation by bacterial ParABS systems is mediated by transient tethering interactions between nucleoid-bound dimers of the ATPase ParA and centromere (parS)-associated complexes of the clamp-forming CTPase ParB. The lifetime of these interactions is limited by the ParB-dependent activation of ParA ATPase activity. Here, we elucidate the functional interplay between ParA and ParB in the model bacterium Myxococcus xanthus. We demonstrate that the N-terminal ParA-binding motif of ParB associates with a conserved bipartite binding pocket at the ParA dimer interface, in a manner dependent on ParB clamp closure. Moreover, we show that ParB and non-specific DNA interact cooperatively with ParA and synergistically induce structural changes in its Walker A and Walker B motifs that correlate with the activation of ParA ATPase activity. These results advance our understanding of the mechanism underlying DNA transport by the ParABS system and may help to unravel the mode of action of related cargo-positioning systems.


Conflict of interest statement

Competing interests: The authors declare no competing interests.

Figures

Fig. 1
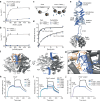
Fig. 1. ParA binds the N-terminal region of ParB with a preference for closed ParB clamps.
a Schematic of the biolayer interferometry (BLI) setup used to study the interaction of ParA with ParB. Double-biotinylated DNA fragments (234 bp) containing a central M. xanthus parS site were immobilized on a streptavidin-coated biosensor. Subsequently, ParB or its CTP hydrolysis-deficient ParB-Q52A variant (10 µM) was loaded onto the closed fragments in the presence of CTPγS or CTP (1 mM), respectively, to form stable model partition complexes, which were then analyzed for their interaction with ParA. b BLI analysis of the interaction of ParA with DNA-bound ParB. Wild-type ParB was loaded onto closed parS-containing DNA as described in panel a and probed with the indicated concentrations of ParA-R238E (ParA*) in the presence of ATP (1 mM). At the end of the association phase, the biosensor was transferred into protein- and nucleotide-free buffer (Wash) to follow the dissociation kinetics. Shown is a representative experiment (n = 3). c Conservation of the N-terminal region of ParB. Shown are a schematic depicting the domain organization of ParB and a sequence logo showing the conserved ParA-binding motif, based on an alignment of 3800 ParB homologs obtained by protein BLAST analysis with M. xanthus ParB as a query. Residues are colored according to their physico-chemical properties (black: hydrophobic, blue: positively charged, red: negatively charged, green: polar). d BLI analysis investigating the role of the N-terminal region of ParB in the ParA-ParB interaction. ParB or ParBΔ21 were loaded onto closed parS-containing DNA as described in (a) and probed with ParA-R238E (ParA*) (10 µM) in the presence of ATP and CTP (1 mM each). Shown is a representative experiment (n = 3 independent replicates). e Subcellular localization of ParB and ParBΔ21 in M. xanthus. Cells producing Tq-ParB (MO072) or Tq-ParBΔ21 (LS007) in place of wild-type ParB were stained with 4′,6-diamidino-2-phenylindole (DAPI) prior to analysis by phase contrast and fluorescence microscopy. The images show overlays of the sfmTurquoise2ox (Tq) and DAPI signals, with the cell outlines indicated in white (bar: 5 µm). The demographs on the right summarize the subcellular distribution of the Tq signal in representative subpopulations of cells (n = 400 per strain). The single-cell fluorescence profiles were sorted according to cell length and stacked on top of each other. f Role of the opening state of ParB clamps in the stimulation of the ParA ATPase activity. The graphs show that ATPase activities of ParA (5 μM) incubated with ParB-Q52A (ParB*) (10 µM) in a buffer containing ATP (1 mM) and salmon sperm DNA (100 µg/mL) in the absence (“open”) or presence (“closed”) of CTP (1 mM) and a short parS-containing DNA stem-loop (250 nM). A reaction containing closed ParBΔ21 clamps served as a negative control (Δ21). Data represent the mean of three independent replicates (±SD). The results were fitted to a Hill equation to account for the sigmoidal shape of the binding curve. However, note that for the first data points, [ParB*] is within the range of the ParA concentration and close to the KD of the ParA-ParB interaction (see b), leading to titration of the free ligand species. Moreover, due to the close linkage of the N-terminal peptides in the ParB dimer, the reactions may be influenced by avidity effects. Therefore, it is not straightforward to determine whether the binding behavior observed actually signifies cooperativity in the binding process. Source data are provided as a Source data file.
Fig. 2
Fig. 2. The conserved N-terminal region of ParB interacts with a hydrophobic cleft at the ParA dimer interface.
a Stimulation of the ParA ATPase activity by the ParB1-20 peptide. The graph shows the ATPase activity of ParA (5 μM) in reactions containing ATP (1 mM) and increasing concentrations of ParB1-20 in absence and presence of salmon sperm DNA (100 µg/mL). Data represent the mean of three independent replicates (±SD). The results were fitted to a Hill equation. b Stimulation of the ParA ATPase activity by DNA. The graph shows the ATPase activity of ParA (5 μM) in reactions containing ATP (1 mM) and increasing concentrations of salmon sperm DNA in the presence and absence of ParB1-20 (100 µM). Data represent the mean of three independent replicates (±SD). The results were fitted to a Hill equation. c Schematic of the BLI setup used to study the non-specific interaction of ParA with DNA. d BLI analysis investigating the DNA-binding affinity of ParA in the presence of the ParB1-20 peptide. Streptavidin-coated biosensors carrying a closed double-biotinylated DNA fragment (234 bp) were probed with the indicated concentrations of wild-type ParA in the absence or presence of ParB1−20 (150 µM). The wavelength shift values obtained at the end of the association phase were plotted against the corresponding ParA concentrations and fitted to a one-site specific-binding model. The graph shows representative experiments. The KD values given in the graph indicate the mean (±SD) of three independent replicates. e Predicted structure of an M. xanthus ParA21-274 (gray) dimer in complex with a closed M. xanthus ParB clamp (blue), determined with Alphafold-Multimer and shown in cartoon representation. f Predicted structure of an M. xanthus ParA21-274 dimer (gray) in complex with two ParB1-20 peptides (blue), determined with Alphafold-Multimer and shown in cartoon representation. The orange rectangle indicates the region highlighted in (f). The structural coordinates are provided in Supplementary Data 2. g Predicted ParB-binding site, based on the structural model described in (f). Residues in ParA (orange) and ParB1-20 (blue) that are involved in the interaction are shown in stick representation. h BLI analysis of the interaction of ParA with DNA-bound ParB variants carrying exchanges in the ParA-binding motif. The indicated ParB variants were loaded onto a closed parS-containing DNA fragment (see Fig. 1a) and probed with ParA-R238E (ParA*) (5 µM) in the presence of ATP and CTP (1 mM each). At the end of the association phase, the biosensors were transferred into nucleotide- and protein-free buffer to monitor the dissociation reactions. Shown are the results of a representative experiment (n = 2 independent replicates). i, j BLI analysis of the ParB-binding activity of ParA variants with one (i) or two (j) amino acid substitutions in the predicted ParB-binding pocket. Wild-type ParB was loaded onto a closed parS-containing DNA fragment (see Fig. 1a) and probed with the indicated ParA-R238E (ParA*) variants (5 µM) as described in panel h. Source data are provided as a Source data file.
Fig. 3
Fig. 3. NMR spectroscopy confirms the predicted ParB-binding site of ParA.
a Chemical shift perturbations (CSPs) observed upon titration of isotopically labeled ParA21-274-D60A dimers with increasing concentrations of unlabeled ParB1-20 peptide, monitored using a two-dimensional 1H-15N transverse relaxation-optimized heteronuclear single quantum correlation (TROSY-HSQC) experiment. Shown are overlaid spectra zooming into regions that have been assigned to specific residues and exhibit strong CSPs (full spectra available in Supplementary Fig. 8). b Ranking and assignment of the CSPs obtained in the HSQC experiment described in (a). The CSPs observed in the presence of 0.7 molar equivalents of ParB1-20 were sorted by magnitude, with assigned CSPs shown in a color gradient from light blue (lowest CSP) to red (highest CSP) and unassigned CSPs depicted in gray. The dashed line denotes the average CSP in the experiment. The inset shows a plot of the CSPs onto a structural model of the M. xanthus ParA21-274 dimer in complex with two ParB1-20 peptides (as in Fig. 2f), using the same color code as described above. The ParB1-20 molecules are shown as yellow ribbons with their N- and C-termini indicated. The two ParA subunits are colored in shades of gray.
Fig. 4
Fig. 4. Cooperative ParB and DNA binding induces structural changes at the catalytic site of ParA.
a Hydrogen-deuterium exchange (HDX) analysis of the effect of ParB1-20 on wild-type ParA dimers. Shown is the difference in deuterium uptake by ParA (50 µM) in deuterated buffer containing ATP (1 mM) in the presence and absence of ParB1-20 (1 mM), mapped onto the crystal structure of the ParA21-274-D60A•ATP dimer in surface representation (t = 1000 s; Supplementary Fig. 9a and Supplementary Data 1). b Nucleotide content analysis investigating the effect of DNA and ParB1-20 on the ATPase activity of ParA under single-turnover conditions. Wild-type ParA or ParA-D60A (50 µM) was incubated with salmon sperm DNA (1 mg/mL) and/or ParB1-20 (1 mM) for 30 min at room temperature. After denaturation of the proteins, the released nucleotides were separated by HPLC and detected at a wavelength of 260 nm. The data show a representative experiment (n = 2). c HDX analysis investigating the structural changes in ParA-D60A dimers induced by ParB and DNA binding. ParA-D60A (50 µM) was incubated in deuterated buffer containing ATP and CTP (1 mM each) either alone or in the presence of salmon sperm DNA (1 mg/mL) and/or ParB-Q52A (ParB*) (100 µM) pre-incubated with a parS-containing DNA stem-loop (2.5 µM) to induce its transition to the closed state. The heatmap shows the maximal differences in deuterium uptake by ParA-D60A in the DNA-bound, ParB*-bound and DNA/ParB*-bound states compared to the apo-state for selected residues in the Walker A and Walker B regions, in a region at the dimer interface linking the DNA-binding site and the Walker A loop, and in the DNA-binding region (see Supplementary Fig. 9c and Supplementary Data 1 for details). (d) Global changes in the HDX pattern of ParA-D60A dimers upon incubation with DNA and/or ParB*. Shown are the maximal differences in deuterium uptake for each of the comparisons described in (c) mapped onto the crystal structure of the ParA21-274-D60A•ATP dimer in cartoon representation. ATP molecules are shown in orange, Mg2+ ions in green (see Supplementary Fig. 9c and Supplementary Data 1 for details). e Crystal structure of ParA21-274-D60A•ATP with a modeled ParB1-20 peptide taken from the predicted structure in Fig. 2f, shown in cartoon representation. ATP is depicted in orange, the Mg2+ ion in green. Hydrophobic residues in ParB1-20 (blue) and the Walker B-proximal loop of ParA (light red) are shown in stick representation. The Walker A (purple) and Walker B (magenta) motifs are highlighted, with catalytically relevant residues shown as sticks. Source data are provided as a Source data file.
Fig. 5
Fig. 5. Residue R13 of ParB is dispensable for ParA binding but critical for ATPase stimulation.
a BLI analysis of the interaction of ParA with DNA-bound ParB-Q52A (ParB*) variants lacking the conserved residue R13. The indicated ParB-Q52A variants were loaded onto a closed parS-containing DNA fragment (see Fig. 1a) and probed with ParA-R238E (ParA*) (5 µM) in the presence of ATP and CTP (1 mM each). At the end of the association phase, the biosensors were transferred into nucleotide- and protein-free buffer to monitor the dissociation reactions. Shown are the results of a representative experiment (n = 3 independent replicates). b Stimulation of the ParA ATPase activity by ParB-Q52A (ParB*) variants lacking R13. Shown is the ATPase activity of ParA (5 μM) in the presence of increasing concentrations of the indicated ParB-Q52A variants in reactions containing ATP (1 mM), CTP (1 mM), salmon sperm DNA (100 µg/mL) and a parS-containing DNA stem-loop (250 nM). Data represent the mean of four independent replicates (±SD), normalized to reactions without ParB*. The results were fitted to a Hill equation. c Subcellular localization of ParB variants lacking R13 in M. xanthus. Cells producing Tq-ParB (MO072), or Tq-ParB-R13K (LS005) or Tq-ParB-R13A (LS004) in place of wild-type ParB were stained with DAPI prior to analysis by phase contrast and fluorescence microscopy. The images show overlays of the Tq and DAPI signals, with the cell outlines indicated in white (bar: 5 µm). The demographs on the right summarize the subcellular distribution of the Tq signal in representative subpopulations of cells (n = 400 per strain). d Quantification of the number of fluorescent foci in cells producing wild-type (WT) Tq-ParB (MO072, n = 358) or its R13K (LS005, n = 422) or R13A (LS004, n = 369) derivative in place of the native ParB protein. e Immunoblot analysis of the strains analyzed in panel c with anti-GFP antibodies. A ΔparB mutant producing untagged ParB under the control of an inducible promoter (SA4269) was used as a negative control (−). Shown is a representative image (n = 3 independent replicates). Source data are provided as a Source data file.
Fig. 6
Fig. 6. Residue R13 of ParB binds a conserved site adjacent to the ParA dimer interface.
a Schematic representation of M. xanthus ParA. Regions involved in ATP binding and hydrolysis, including the Walker A motif (purple), Motif 2 (light red), and the Walker B motif (magenta), are highlighted. Regions that show DNA-dependent protection in HDX experiments (see Fig. 4c, d) are shown in blue. b Conservation of the helix H4/H6/H7 region of ParA. The graph shows a sequence logo of the helix H4/H6/H7 region based on an alignment of 3800 ParA homologs obtained by protein BLAST analysis with M. xanthus ParA as a query. Residues are colored according to their physico-chemical properties (as in Fig. 1c). The numbering indicates the corresponding residues in M. xanthus ParA. Residues investigated in this study are highlighted by arrowheads. c Magnification of the predicted binding site of residue R13 of ParB on the ParA dimer surface, taken from the model in Fig. 2f. Interacting residues are shown in stick representation and labeled, with R13 modeled in one of its possible rotameric states. The inset indicates the location of the magnified region in the ternary complex (orange rectangle). d BLI analysis of the interaction between DNA-bound ParB and ParA variants with amino acid exchanges in the helix H4/H6/H7 region. ParB-Q52A (ParB*) (10 µM) was loaded onto a closed parS-containing DNA fragment (see Fig. 1a) and probed with the indicated ParA variants (5 µM) in the presence of ATP (1 mM) and 500 mM KCl. At the end of the association phase, the biosensor was transferred into a protein- and nucleotide-free buffer to follow the dissociation kinetics. e Stimulatory effect of ParB on ParA variants with amino acid substitutions in the H4/H6/H7 region. Shown are the ATPase activities of the indicated ParA variants (2.5 µM) in the presence of ATP and CTP (1 mM each) with or without ParB-Q52A (10 µM), salmon sperm DNA (100 µg/mL), and/or a parS-containing DNA stem-loop (250 nM). Data represent the mean of four independent replicates (±SD). f Crystal structure of ParA21-274-D60A•ATP with a modeled ParB1-20 peptide taken from the predicted structure in Fig. 2f, shown in cartoon representation. The ParB1-20 peptide (blue), Motif 2 with its catalytic residues D58, D60, and N64 (dark red), and the region connecting Motif 2 and helix H4 (cyan) are highlighted. ATP is depicted in orange, the Mg2+ ion in green. Relevant residues are displayed in stick representation, with R13 shown in one of its possible rotameric states. Source data are provided as a Source data file.
Fig. 7
Fig. 7. Model of the ParA-ParB interaction.
a Role of the ParA-ParB interaction in DNA segregation. ParB clamps are loaded onto the centromere region and form a densely packed partition complex. ParA dimers, by contrast, diffuse across the nucleoid in a low-DNA-affinity state, which ensures a steady flux of dimers towards the partition complex. Closed ParB clamps interact with diffusible DNA-bound ParA dimers, forming a tethering complex that links the partition complex to the nucleoid. Cooperative interactions between the ParB- and DNA-binding sites stabilize the tethering complex and thus enables it to harness the elastic dynamics of chromosomal DNA loops for partition complex movement. The transition to this locked state involves structural rearrangements at the catalytic site of ParA that stimulate its ATPase activity, thereby limiting the lifetime of the tethers. ATP hydrolysis then leads to the dissociation of ParA and its release from both ParB and DNA, allowing the handover of the partition complex to adjacent DNA-bound ParA dimers. b Structural model of the M. xanthus ParA-ParB tethering complex. Shown is a model of a ParB dimer loaded onto parS-containing DNA (green) and interacting with a DNA (pink)-bound ParA dimer. ATP is shown in orange, Mg2+ in green. The ParB2-parS and ParA2-(ParB1-20)2 complexes were modeled separately with AlphaFold 3 and then joined using UCSF-Chimera. The DNA molecule bound to the ParA dimer was fitted into the model based on a superimposition of the predicted ParA2-(ParB1-20)2 complex with the crystal structure of a DNA-bound H. pylori ParA-D41A•ADP dimer (PDB: 6IUD).

References

    1. Badrinarayanan, A., Le, T. B. & Laub, M. T. Bacterial chromosome organization and segregation. Annu. Rev. Cell Dev. Biol.31, 171–199 (2015). - PMC - PubMed
    1. Bouet J. Y. & Funnell B. E. Plasmid localization and partition in Enterobacteriaceae. EcoSal Plus8, 10.1128/ecosalplus.ESP-0003-2019 (2019). - PMC - PubMed
    1. Gerdes, K., Moller-Jensen, J. & Bugge Jensen, R. Plasmid and chromosome partitioning: surprises from phylogeny. Mol. Microbiol.37, 455–466 (2000). - PubMed
    1. Jalal, A. S. B. & Le, T. B. K. Bacterial chromosome segregation by the ParABS system. Open Biol.10, 200097 (2020). - PMC - PubMed
    1. Tisma, M., Kaljevic, J., Gruber, S., Le, T. B. K. & Dekker, C. Connecting the dots: key insights on ParB for chromosome segregation from single-molecule studies. FEMS Microbiol. Rev.48, fuad067 (2024). - PMC - PubMed

MeSH terms

LinkOut - more resources