. 2025 Sep 25;16(1):8422.
doi: 10.1038/s41467-025-64265-6.

Secondary grain boundary dislocations alter segregation energy spectra

Affiliations

Secondary grain boundary dislocations alter segregation energy spectra

Xinren Chen et al. Nat Commun. .

Abstract

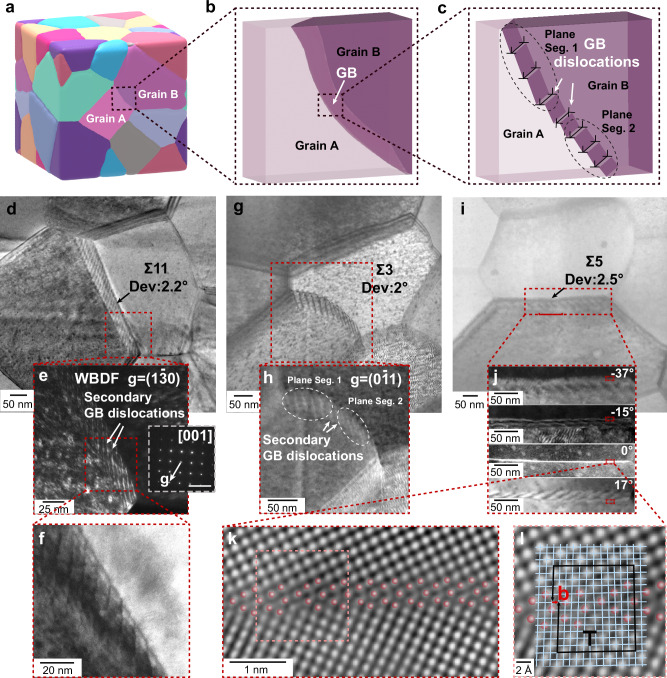
Grain boundaries (GBs) trigger structure-specific chemical segregation of solute atoms. According to the three-dimensional (3D) topology of grains, GBs - although defined as two-dimensional defects - cannot practically be free of curvature. This leads to discrete variations in the GB plane orientations. Topologically required arrays of secondary GB dislocations accommodate these variations as well as deviations from ideal coincidence site lattice GBs. We report here that these pattern-forming secondary GB dislocations can have an additional and, in some cases, even a much stronger effect on GB segregation than defect-free GBs. Using nanoscale correlative tomography combining crystallography and chemical analysis, we quantified the relationship between secondary GB dislocations and their segregation energy spectra for a model Fe-W alloy. This discovery unlocks design opportunities for advanced materials, leveraging the additional degrees of freedom provided by topologically-necessary secondary GB dislocations to modulate segregation.


Conflict of interest statement

Competing interests: The authors declare no competing interests.

Figures

Fig. 1
Fig. 1. Secondary GB dislocations in the Fe-1 at% W specimen.
a Illustration of grain boundaries (GBs) in a three-dimensional (3D) polycrystalline structure. b Magnification of a selected high-angle GB (HAGB) showing curved GB plane. c Illustration of steps and secondary GB dislocations on the GB. d Bright-field image of a transmission electron microscopy (TEM) lamella prepared from the body-centered cubic (BCC) Fe-1 at% W specimen, featuring multiple GBs, one of which is labeled as a HAGB. This HAGB is a Σ11 GB that deviates by 2. 2° from the theoretical misorientation. e Corresponding weak-beam dark-field (WBDF) image of the same area, imaged under the two-beam condition with g=[13¯0]. The inset image in the right side of e displays the diffraction pattern collected from the left grain ([100] zone axis). Scale bar: 1/0.1 nm. f High magnification bright-field image displaying the steps and secondary GB dislocations of the GB. g Bright-field image of a Σ3 GB with a 2 deviation from the ideal misorientation. h Corresponding dark-field image of the Σ3 GB with g=[01¯1], revealing secondary GB dislocations. i Bright-field image of a Σ5 GB that deviates by 2. 5 from the ideal misorientation. j Dark-field images of the Σ5 GB acquired at various α tilt angles. Scale bar: 50 nm. k Magnified view of the area at 0 tilt angle, with semi-transparent red dots highlighting the atomic column configuration near the GB. See additional details in Supplementary Fig. 5. l The region in k overlaid with a displacement shift complete (DSC) lattice and a Frank circuit, illustrating the presence of a secondary GB dislocation characterized by the Burgers vector (b).
Fig. 2
Fig. 2. Correlative tomography characterization of the Fe-1 at% W specimen.
a Illustration of four-dimensional scanning transmission electron microscopy (4DSTEM) tomography. Each pixel in the 4DSTEM data incorporates a local nanobeam diffraction pattern. b Representative nanobeam diffraction patterns from the 4DSTEM datasets at different tilt angles for the grain indicated by red circle in a. Scale bar: 1/0.083 nm. c 3D crystallographic reconstruction of the grains in the Fe-W needle-shaped specimen, characterized via 4DSTEM tomography,. Grains are colored based on the Euler angle representation of their crystallographic orientations relative to the Z-axis, serving as the tilting axis in TEM. The X-axis represents the thin film growth direction in the same coordinate system in Supplementary Fig. 1. d 3D chemical reconstruction of the same specimen shown in c by atom probe tomography (APT), illustrating the spatial distribution of Fe (red) and W (cornflower blue) atoms with a superimposed 5 at% W isosurface. The 5 at% isosurface represents the region (voxels) containing 5 or more at% W. For a clear visualization, we aligned the APT reconstruction in the same perspective as the 4DSTEM tomography reconstruction shown in c.
Fig. 3
Fig. 3. Characterization of secondary GB dislocations and their linkage to segregation patterns in the Fe-1 at% W specimen.
a Compositional mapping of W at a resolution of 0.5 × 0.5 × 0.5 nm3 per voxel, enabling visualization of volume-specific variations. Parts of the grains and GBs have been labeled, with identities ranging from grain α1 to grain α5 and from GB1 to GB2 (see all labels in Supplementary Fig. 7). The X-axis represents the thin film growth direction in the same coordinate system in Supplementary Fig. 1. Correlative crystallographic and compositional quantitative analysis for two GBs GB1: be and GB2: fi. Each set includes: b, f orientation mappings of the local normal to the GB plane between adjacent grains (rendered in translucent gray), with two mappings provided for each GB, referenced to the respective grain involved. Cubic symbols in indicate the orientation of the grains and the red arrow indicates the misorientation rotation axis. c, g 4DSTEM virtual dark-field images; d, h atom maps of Fe (colored red) and W (colored cornflower blue), with superimposed isosurfaces at 2.5 at% W and 4.0 at% W, respectively; e, i W profiles along the red arrows shown in (e, i). The insert images in (c, g) display the nanobeam diffraction patterns with the vectors g=[121¯] for grain α2 and g=[2¯11] for grain α5 (highlighted by red circles), which were used to generate the virtual dark-field images shown in (c, g). Two perspectives (90 rotated clockwise from left to right) in (d, h) are shown to illustrate the segregation patterns in 3D.
Fig. 4
Fig. 4. Mapping and analysis of GB properties in the Fe-1 at% W specimen.
a Integral profiles across GB1 for quantifying the interfacial excess (IE) of W segregation at the Fe GB,. We plot measurements from two points: Point 1 for high W regions (colored pink) and Point 2 for low W segregation regions (colored orange). In each plot, the solid lines show the cumulative relationship between all atoms and solute atoms, while the dashed lines are the fittings within the two grains adjacent to the GB plane. NWexcess represents the accumulation of excess atoms across the GB interface. IE values are calculated by dividing NWexcess by the corresponding interface areas, which are approximately 8.0 nm2 for Point 1 and Point 2. We indicate the locations of Point 1 and Point 2 in the embedded image, consistent with Fig. 3d. b IE mapping on GBs, as identified from the correlative characterization in Fig. 2c, d. We labeled the locations of all investigated GBs from GB1 to GB12 in (b). c Segregation energy mapping on the same GBs as in b, calculated based on the Langmuir-McLean isotherm, Eq. (1),. The locations where 1D line profiles of segregation energy values were measured are marked by red lines S1 and S2, details of which will be presented in the following section. d Correlation between the misorientation and segregation energy of all investigated GBs: This scatter plot displays the average segregation energy (in kJ/mol) for various GBs, plotted against their misorientation (in degrees). Each point represents a different GB (GB1–GB12), with colors indicating the rotation axis of misorientation related to the cubic crystal symmetry (m3¯m), as shown in the color triangle legend. Experimental GB segregation energy spectra for e GB1, f GB2, and g all GBs. Here, n represents the sample size used to derive statistics. The fitting plots, overlaid onto the histograms, generally follow the skew-normal function but with local deviations highlighted by the black arrows, see (e, f). The used fitting parameters are: characteristic energy (μ) in kJ/mol, width (σ) in kJ/mol, and shape parameter (α) along with each plot. The sharp peak appearing near 0 kJ/mol in (g) results from the contribution of the GBs without solute segregation and the inevitable minor inclusion of the bulk regions adjacent to the GBs.
Fig. 5
Fig. 5. Quantifying elastic energy for the Σ13b GB with dislocations using linear anisotropic elasticity theory.
a, b Segregation energy profiles along the lines marked by red arrows in Fig. 4c: a Line S1 at GB1 and b Line S2 at GB2, illustrating variations in segregation energy along these GBs. Horizontal dashed lines in a and b indicate the mean segregation energy of GB1 and GB2, respectively, serving as references. c, d The stress field surrounds secondary GB dislocations for GB2 (Σ13b, see Fig. 3f–i) with the DSC-lattice vectors as Burgers vectors: c DSC-a: bα5=a13[1¯43¯] and d DSC-b: bα5=a13[3¯1¯4]. Here, a is the lattice constant of BCC Fe. e The change in segregation energy (PXSΔV) aligns along the GB (averaged within a 0.5 nm distance from the GB plane), corresponding to (c, d). Here, DSC-a and DSC-b have the same Burgers vectors as those stress fields in (c, d). The modulation factor is defined as expPXSΔVRT. f Maximum change in segregation energy (ΔSeg. Energy) caused by DSC-a or DSC-b dislocations as a function of inclination ϕ. The blue and red circles indicate the experimentally relevant inclinations. g Dislocation density maps for DSC-a and DSC-b types as a function of inclination ϕ and misorientation deviation θ from the ideal Σ13b GB (rotation axis [111]), derived using the Frank-Bilby equation. h Dislocation densities for DSC-a and DSC-b as a function of misorientation deviation θ at a fixed inclination of ϕ = 15.6. i Calculated segregation energy profiles for the Σ13b GB with a misorientation deviation of θ = 0.6, showing contributions from DSC-a, DSC-b secondary GB dislocations, and their combined effect.

References

    1. Ashby, M. The deformation of plastically non-homogeneous materials. Philos. Mag. J. Theor. Exp. Appl Phys.21, 399–424 (1970).
    1. Chen, Y. et al. Revealing grain boundary kinetics in three-dimensional space. Acta Mater.268, 119717 (2024).
    1. Bishop, G. H., Chalmers, B. A coincidence-ledge-dislocation description of grain boundaries. Scr. Met.2, 133–139 (1968).
    1. Hirth, J. & Balluffi, R. On grain boundary dislocations and ledges. Acta Met.21, 929–942 (1973).
    1. Rajabzadeh, A. et al. The role of disconnections in deformation-coupled grain boundary migration. Acta Mater.77, 223–235 (2014).

LinkOut - more resources