Review
. 2025 Sep 11;8(18):13050-13121.
doi: 10.1021/acsaem.5c01989. eCollection 2025 Sep 22.

Materials Engineering for High Performance and Durability Proton Exchange Membrane Water Electrolyzers

Affiliations
Review

Materials Engineering for High Performance and Durability Proton Exchange Membrane Water Electrolyzers

Pablo A García-Salaberri et al. ACS Appl Energy Mater. .

Abstract

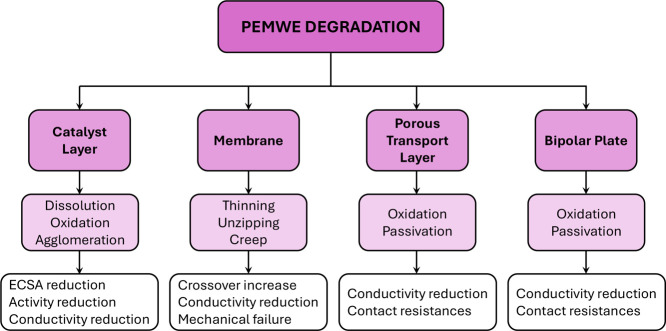
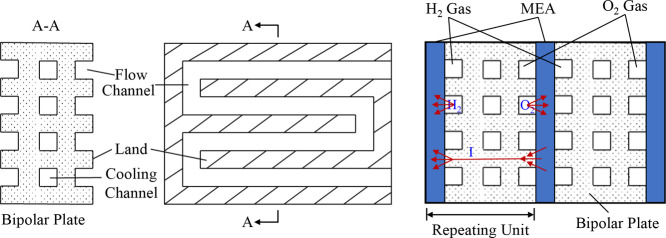
Proton exchange membrane water electrolyzers (PEMWEs) are expected to play a crucial role in the global green energy transition during the 21st century. They provide a versatile and sustainable solution for generating hydrogen with very high purity in combination with renewable energies, such as solar and wind. Despite their promise, PEMWEs face several critical problems, including high costs, performance limitations, and durability challenges, particularly at low iridium (Ir) loading on the anode. Advancing next-generation PEMWEs requires extensive work on materials engineering of all cell components, including the catalyst layer (CL), membrane, porous transport layer (PTL), bipolar plate (BPP), and gasket. This task must be performed with the complementary contribution of different modeling and characterization techniques. This review presents a critical perspective from academia, research centers, and industry, mapping main developments, remaining gaps, and strategic pathways to advance PEMWE technology. A focus is devoted to key aspects, such as operation at low Ir loading, membrane durability, multiscale transport layers, porous and non-porous flow fields, multiphysics modeling, and multipurpose characterization techniques, which are thoroughly discussed. By unifying these topics, this review provides readers with the essential knowledge to grasp current developments and tackle tomorrow's challenges in PEMWE engineering.

Keywords: PEMWE; characterization; design; durability; materials; modeling; performance.


Figures

1
1
(a) Schematic of the planar structure of a cell within a PEMWE stack, indicating the location of the bipolar plates (BPPs) and the membrane electrode assembly (MEA). (b) Magnification of the cross-section of a PEMWE cell with the geometry of its main components: BPPs, porous transport layers (PTLs), catalyst layers (CLs), and proton exchange membrane (PEM). The channel/rib pattern of the BPP is indicated. Drawing dimensions are not to scale.
2
2
Breakdown of the cost of (a) 1 MW PEMWE system, divided into stack, power supplies and balance of plant, and (b) 5 MW PEMWE stack components, divided into CCM, BPP, anode PTL, cathode PTL and other. Data in (a) extracted from the 2019 National Renewable Energy Laboratory report based on a 50,000 units/year production rate, and in (b) from the 2021 Fraunhofer ISE report based on forecast predictions for 2030.
3
3
(a) Histogram of the number of publications per year with the topic “PEMWE” in the period 1990–2024. (b) Histogram of the number of publications per year with the topics “PEMWE and string”, where string is either CL, Nafion, PTL or BPP, in the period 2005–2024. Source: Web of Science.
4
4
(a) Overpotentials breakdown (activation, ohmic and mass) reported by different literature sources. ,− The fitted curves to the data sets are represented by solid lines. (b) Polarization curves reported for PEMWEs with different materials engineering improvements: conventional, ,,, BPP/PTL assembly, CL, PEM, and PEM+PTL. Operating temperature, T = 80 °C.
5
5
Flowchart of the main degradation phenomena that take place in the CL, membrane, PTL and BPP of a PEMWE, especially at the anode side.
6
6
(a) Prices of Pt and Ir from 2005 to 2025. Data extracted from Matthey. Copyright 2025 Johnson Matthey. (b) World mine production of Pt, Ir, and Pd from 1998 to 2018. Figure adapted from ref . Copyright 2021 The Authors under Creative Commons Attribution 4.0 License (http://creativecommons.org/licenses/by/4.0/). (c) Breakdown of PEMWE stack manufactured cost vs annual production rate. Figure adapted from ref . Copyright 2024 National Renewable Energy Laboratory.
7
7
Transport processes at the anode for a conventional ionomer-bound IrO x CL. Liquid water, transported through the pores of the PTL to the anode CL, reacts at the catalyst active sites, producing electrons, protons, and oxygen. Electrons are conducted in the in-plane direction through the IrO x and in the through-plane direction to reach the Ti PTL. Protons are primarily transported through the ionomer network to reach the membrane, then conducted across toward the cathode. Product oxygen gas must diffuse back through the water-filled pore network of the CL and the PTL to be removed from the cell. Additionally, electroosmotic drag results in the transport of water through the membrane to the cathode.
8
8
Strategies for anode CL improvements, focused on material synthesis for increasing the intrinsic OER activity of the catalyst, and on structural engineering of catalysts and CLs for improving catalyst utilization.
9
9
(a) Humidity-dependent swelling of Nafion thin films (40 ± 5 nm) on metallic Irm and IrO2, and (b) aggregate diameters of Irm (left) and IrO2 (right) catalyst inks with (blue) and without (gray) Nafion. Reproduced from ref . Copyright 2024 American Chemical Society.
10
10
Conventional CL preparation: (i) ink slurry is made by combining catalyst particles, solvents, and ionomer; (ii) ink is dispersed via methods like ultrasonication; (iii) ink is coated onto a substrate using blade coater; (iv) CL is hot pressed onto membrane and peeled off the substrate; and (v) anode CL is on a membrane (CCM configuration) or, alternatively, on a PTL (PTE configuration).
11
11
Structures of the three main PFSA ionomers. (a) Short side chain made by Syensqo, (b) medium side chain – now discontinued – from 3M, and (c) long side chain from Chemours, AGC, and others.
12
12
(a) Compression creep of pretreated Nafion 117 at 5 and 35 MPa and in dry and wet conditions. (b) Creep strain of these tests with the creep strain of the first hour in light blue and the creep strain after the first hour in blue. Reproduced from ref . Copyright 2021 American Chemical Society.
13
13
Primary reaction sites for radical degradation of a long side chain ionomer by either peroxyl radicals (HO·) or hydrogen atoms (H·).
14
14
(Left) Literature reported FRR as a function of current density, and (right) averaged data at 80 °C and 1 A cm–2 for the three main membrane types reported.
15
15
Estimated fluoride release rate (FRR) as a function of membrane thickness needed to maintain 10% loss of membrane for three typical electrolysis lifetime targets.
16
16
Examples of hydrocarbon ionomers from FuMaTech, sulfonated polyetheretherketone (sPEEK), and Ionomr Innovations, sulfonated polyphenylene (sPP).
17
17
Water uptake (WU) against IEC. All data collected after submersion in water. Water temperatures between 20 and 95 °C. −
18
18
Ionic conductivity against IEC. All data from membranes submerged in water. (Left) temperature between 20 and 40 °C, and (right) temperature between 40 and 80 °C. −
19
19
Hydrogen and oxygen permeability coefficients against RH. Measured at 80 °C. − ,,,−
20
20
Contour plots visualizing the (a–c) catalyst distribution and (d–f) TPCA for a sintered PTL and two MPLs in a 1 mm2 region. The color bars represent the percentage of catalyst for catalyst distribution and the percentage of catalyst in contact with the region for TPCA. Adapted from ref . Copyright 2023 American Chemical Society.
21
21
Plot showing cell potential at a current density of 3 A cm–2 vs time for different types of coatings. Adapted from ref . Copyright 2025 The Authors under Creative Commons Attribution 4.0 License (https://creativecommons.org/licenses/by/4.0/).
22
22
Schematic illustration of a PEMWE stack: (left) cross-sectional view of a BPP with an integrated cooling flow channel between the anode and cathode flow fields; (middle) face view of the flow-field design; and (right) repeating unit of the stack structure comprising BPPs and MEAs. Adapted from ref with permissions from Elsevier B.V.
23
23
Representative flow-field configurations commonly used in PEMWEs, including serpentine, parallel, and interdigitated patterns. Reproduced from ref with permissions from Elsevier B.V.
24
24
Schematic of different sealing structures used in PEMWEs: (a) PEM direct sealing structure, (b) rigid protective frame sealing, and (c) PEM-wrapped frame sealing structure. Adapted from ref with permissions from Elsevier B.V.
25
25
Schematic of the solution variables usually included in varying complexity proton exchange membrane electrolyzer models and their physical area of interest.
26
26
Schematic of different solution techniques to study multiphase flow in PEMWE. Adapted from refs ,, . Copyright 2021–24 The Authors under CC BY 4.0 International License (https://creativecommons.org/licenses/by/4.0/). Portions of the figure are also adapted from ref with permissions from Elsevier B.V.
27
27
(Top) interface between the ACL and PTL, demonstrating that only part of the ACL is in contact with the Ti PTL. (Bottom) demonstration of the poor utilization of the ACL when the layer has a high in-plane electronic resistance. Thinner ACLs typically exhibit a higher resistance than thicker layers. Adapted from ref . Copyright 2025 The Authors under Creative Commons Attribution 4.0 License (https://creativecommons.org/licenses/by/4.0/).
28
28
Schematic of the expected hydrogen transport direction in a PEMWE. (a) diagram of the expected gas phase exchanges, (b) example of the dynamic changes reported in ref during a current density step change from 4.5 to 1.62 A/cm2, (c) hydrogen-in-oxygen content in the anode channel, and (d) 1D through-plane dissolved hydrogen concentration profiles. Reproduced with permissions from Elsevier B.V.
29
29
XRD patterns for (a) rutile, amorphous and amorphous-metal catalyst powders. Adapted from ref . Copyright 2024 The Authors under CC BY-NC-ND 4.0 International License (https://creativecommons.org/licenses/by-nc-nd/4.0/). (b) PTEs before (red) and after (orange) AST. Adapted from ref . Copyright 2023 The Authors under CC BY 4.0 International License (https://creativecommons.org/licenses/by/4.0/).
30
30
TGA and DTG of Nafion 117 membrane and its ZrP nanocomposite membranes. Reproduced from ref . Copyright 2019 The Authors under CC BY-NC-ND 4.0 International License (https://creativecommons.org/licenses/by-nc-nd/4.0/).
31
31
(a) Ir L2 XANES (left) and Ir L2 FT-EXAFS (right) spectra for catalyst powders and anodes from cycled MEAs (a1 and a3) AA, (a2 and a4) JM. Adapted from ref . Copyright 2024 The Authors under CC BY 4.0 International License (https://creativecommons.org/licenses/by/4.0/). XANES spectra acquired at 1.00 and 1.60 VRHE on (b1) IrO x AS, (b3) IrO x HT, (b2) IrO x AA, (b4) IrO x Umi. (b5) Difference of the spectra acquired at 1.60 and 1.00 VRHE (Δμ) and (b6) relation between Δμmax and the ratio of oxygen species extracted from the O K edge XAS measurements. Adapted from ref . Copyright 2023 The Authors under CC BY 4.0 International License (https://creativecommons.org/licenses/by/4.0/).
32
32
Normalized XPS Ir 4f spectra acquired from Ir(100) before and after oxidation of the surface (a1) 720 eV and (a2) 250 eV. Adapted from ref . Copyright 2020 American Chemical Society. Theory-based Ir fit models for (b1) amorphous IrO x and (b2) rutile IrO2. Adapted from ref . Copyright 2016 The Authors under CC BY 3.0 Unported License (https://creativecommons.org/licenses/by/3.0/). O 1s XPS spectra with fitted contributions of oxygen and species of (c1) amorphous TKK and (c2) rutile TKK. Adapted from ref . Copyright 2024 The Authors under CC BY-NC-ND 4.0 International License (https://creativecommons.org/licenses/by-nc-nd/4.0/). High-resolution spectra of the spray coated CL 0.2 mgIr cm–2 of (d1) Ir 4f and (d2) F 1s. O 1s curve-fitting for (d3) bare IrO2 catalyst and (d4) 0.2 mgIr cm–2 spray coated CL. Adapted from ref . Copyright 2025 The Authors under CC BY-NC-ND 4.0 International License (https://creativecommons.org/licenses/by-nc-nd/4.0/).
33
33
Top-down SEM images of: ss-BPP (a1) pristine and (a2) aged. Adapted from ref . Copyright 2022 The Authors under CC BY 4.0 International License (https://creativecommons.org/licenses/by/4.0/). (b) Pristine IrO2/TiO2 catalyst powder. Adapted from ref . Copyright 2023 The Authors under CC BY 4.0 International License (https://creativecommons.org/licenses/by/4.0/). (c) felt PTE, (d) sintered PTE, (e) CCM. Adapted from refs , . Copyright 2023 The Authors under CC BY 4.0 International License (https://creativecommons.org/licenses/by/4.0/). (f1) pristine MEA, (f2) aged MEA, (f3) EDS maps of aged MEA Ir, O, F, S and cross-sectional SEM images of (h1–3) aged MEA. Adapted from ref . Copyright 2023 The Authors under CC BY 4.0 International License (https://creativecommons.org/licenses/by/4.0/).
34
34
Top-down SEM images (top) and XTM surface renderings (bottom) of (a1) MPL + support layer, (a2) MPE with 2.5 mgIr cm–2 loading, and (a3) Ti-felt (Bekaert) with 2.5 mgIr cm–2 loading. Cross-section XCT slices, as gray scale (left) and segmented (right) images of (b1) an MPE and (b2) a PTE (based on Ti-felt) with 2.5 mgIr cm–2 loading, where the pores are black and the CL is in blue and red. Adapted from ref . Copyright 2023 The Authors under CC BY 4.0 International License (https://creativecommons.org/licenses/by/4.0/).
35
35
AFM measurements of pristine (top) and aged (bottom) MEAs: (a and d) height measurement, (b and e) conductivity measurement, (c and f) deformation measurement. Adapted from ref . Copyright 2023 The Authors under CC BY 4.0 International License (https://creativecommons.org/licenses/by/4.0/).
36
36
FIB cross-section of the Ir-coated PTL after 4,000 h of operation (a1) EDS composition analysis, (a2) Line-scanning profile. Adapted from ref . Copyright 2021 The Authors under CC BY 4.0 International License (https://creativecommons.org/licenses/by/4.0/). High-resolution TEM images of (b1) IrO x ·nH2O and (b2) IrO2. HAADF-STEM images of (b3) IrO x ·nH2O and (b4) IrO2. Adapted from ref . Copyright 2024 The Authors under CC BY 4.0 International License (https://creativecommons.org/licenses/by/4.0/). HAADF-STEM and EDS spectrum images (Ir, F) of cross-sectioned anode CLs after AST from MEAs with (c1) AA Ir, (c2) TKK Ir, (c3) JM Ir. Adapted from ref . Copyright 2024 The Authors under CC BY 4.0 International License (https://creativecommons.org/licenses/by/4.0/). HAADF-STEM EDS images of degraded MEA (d1) anode CL, (d2) membrane adjacent to the cathode, (d3) EDS map of the cathode. Adapted from ref with permissions from Elsevier B.V.
37
37
ToF-SIMS depth profiles of PTLs (a) pristine uncoated PTL, (b) pristine Ir-coated PTL, (c) pristine Pt-coated PTL, (d) uncoated PTL after 4,000 h, (e) Ir-coated PTL after 4,000 h, and (f) Pt-coated PTL after 4,000 h. Adapted from ref . Copyright 2021 The Authors under CC BY 4.0 International License (https://creativecommons.org/licenses/by/4.0/).

References

    1. Seck G. S., Hache E., Sabathier J., Guedes F., Reigstad G. A., Straus J., Wolfgang O., Ouassou J. A., Askeland M., Hjorth I., Skjelbred H. I., Andersson L. E., Douguet S., Villavicencio M., Trüby J., Brauer J., Cabot C.. Hydrogen and the decarbonization of the energy system in Europe in 2050: A detailed model-based analysis. Renew. Sustain. Energy Rev. 2022;167:112779. doi: 10.1016/j.rser.2022.112779. - DOI
    1. Brandon N. P., Kurban Z.. Clean energy and the hydrogen economy. Philos. Trans. R. Soc. A. 2017;375:20160400. doi: 10.1098/rsta.2016.0400. - DOI - PMC - PubMed
    1. Pathak P. K., Yadav A. K., Padmanaban S.. Transition toward emission-free energy systems by 2050: Potential role of hydrogen. Int. J. Hydrog. Energy. 2023;48:9921–9927. doi: 10.1016/j.ijhydene.2022.12.058. - DOI
    1. Puertas-Frías C. M., Willson C. S., García-Salaberri P. A.. Design and economic analysis of a hydrokinetic turbine for household applications. Renew. Energy. 2022;199:587–598. doi: 10.1016/j.renene.2022.08.155. - DOI
    1. Yang B., Zhang R., Shao Z., Zhang C.. The economic analysis for hydrogen production cost towards electrolyzer technologies: current and future competitiveness. Int. J. Hydrog. Energy. 2023;48:13767–13779. doi: 10.1016/j.ijhydene.2022.12.204. - DOI

LinkOut - more resources