[Preprint]. 2025 Sep 16:2025.09.10.675380.
doi: 10.1101/2025.09.10.675380.

Next-Generation Multiplexed Targeted Proteomics Quantifies Post-Translational Modifications, Compound-Protein Interactions, and Disease Biomarkers with High Throughput

Affiliations

Next-Generation Multiplexed Targeted Proteomics Quantifies Post-Translational Modifications, Compound-Protein Interactions, and Disease Biomarkers with High Throughput

Steven R Shuken et al. bioRxiv. .

Abstract

The GoDig platform enables sensitive, multiplexed targeted pathway proteomics without manual scheduling or synthetic standards. Here we present GoDig 2.0, which increases sample multiplexing to 35-fold, improves time efficiency and reduces scan delays for higher success rates, and allows flexible spectral and elution library generation from different mass spectrometry data types. GoDig 2.0 measures 2.4× more targets than GoDig 1.0, quantifying >99% of 800 peptides in a single run. We compiled a library of 23,989 human phosphorylation sites from a phosphoproteomic dataset and used it to profile kinase signaling differences across cell lines. In human brain tissue, we established a hyperphosphorylated tau assay including pTau127, revealing potential biomarkers for Alzheimer's disease. We also quantified diglycyl-lysine peptides to assess polyubiquitin branching. Finally, we built a library of 20,946 reactive cysteines and profiled covalent compound-protein interactions spanning diverse pathways. GoDig 2.0 enables high-throughput analyses of site-specific protein modifications across many biological contexts.


Conflict of interest statement

COMPETING INTERESTS J.D.C. is a full-time employee of Thermo Fisher Scientific, which manufactures the Orbitrap Eclipse and Orbitrap Ascend mass spectrometers.

Figures

Figure 1.
Figure 1.. GoDig 2.0 improves on success rates, throughput, and ease of use compared to GoDig 1.0.
A. Limitations and features of GoDig 1.0 and 2.0. B. Generic GoDig 2.0 workflow depicting the analysis of modified peptides using TMTproD 35plex reagents.
Figure 2.
Figure 2.. GoDig 2.0 quantifies over 2.4x more targets than GoDig 1.0 in a challenging context.
For details about the target list and GoDig 2.0 features and parameters, see the Supplementary Information and Supplementary Figures. Identified = passed spectral match filters. Quantified = summed signal-to-noise exceeded 10/channel. Upper bound on performance at 1,300 targets is indicated by dashed red line. Corrected EO bins from 6 priming runs were used for all of these experiments (Ref. 10).
Figure 3.
Figure 3.. GoDig 2.0 increases effective sample throughput from 6.7 min/sample to 3.4 min/sample with TMTproD.
A. TMTproD 35plex sample and target list used to show compatibility with GoDig 2.0. SPD = samples per day. B. Principal component analysis (PCA) using untargeted RTS-SPS-MS3 analysis with resolution = 120,000 and GoDig 2.0 with resolution = 60,000 and TurboTMT enabled. Column normalization = dividing each column (channel) by its total sum. Subplex mean normalization = dividing each measurement by the mean of measurements for that target within the subplex (i.e., all non-D channels or all D channels). C. Scatter plots showing the correlation of quantities between replicate untargeted RTS-SPS-MS3 runs (“RTS”) and between one RTS run and a GoDig 2.0 run. Z-scores were calculated within each MS3 scan. R = Pearson correlation coefficient.
Figure 4.
Figure 4.. GoDig 2.0 enables the repurposing of existing phosphoproteomic data for streamlined targeted pathway analysis.
A. Data repurposing workflow depicted with phosphoproteomic data as an example. Previously acquired untargeted LC-MS/MS data, including PTM analyses, regardless of fragmentation mode, buffer gradient, or ion mobility-based separation, can be built into spectral and elution libraries using GoDig 2.0. B. A three-pathway targeted phosphoproteomic experiment performed with GoDig 2.0. For each pathway, 3 priming runs and 1 analytical run were performed (Ref. 10). C. Examples of phosphoprotein abundance differences in the Raf-MEK-ERK portion of the MAPK cascade in a 5-cell-line 18plex. D. Heat map of Z-transformed GoDig 2.0 measurements. Rows are phosphoproteins and columns are cell line replicates.
Figure 5.
Figure 5.. Targeted Phosphoproteomics in Brain Tissue from Patients with Alzheimer’s Disease using GoDig 2.0.
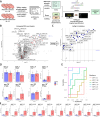
A. Screen-to-validation workflow. B. Volcano plot showing results of untargeted HCD-HRMS2 analysis with significant and Tau (MAPT) phosphoproteins highlighted. Semicolon indicates that the protein is phosphorylated at two sites. FDR threshold was set using the Benjamini-Hochberg threshold correction method (Ref. 24). C. Volcano plot showing results of GoDig analysis of Tau sites. D. Quantification of a selection of sites with untargeted HCD-HRMS2 and GoDig 2.0. E. Receiver operating characteristic (ROC) plots of a selection of Tau phosphorylation sites. F. Quantitative data from the 11 Tau sites with perfect ROC curves (area under the curve = 1). MAPT represents isoform 8 of tau on Uniprot (P10636–8), and MAPT-1, MAPT-6, and MAPT-7 represent isoforms 1, 6, and 7, respectively.
Figure 6.
Figure 6.. Targeted Streamlined Cysteine Activity-Based Protein Profiling (SLC-ABPP) with GoDig 2.0.
A. Preparation of a GoDig library consisting of 20,946 cysteines that are reactive in live K562 cells. B. Dose-response experiment workflow. Gray-colored wells were treated with DMSO as a negative control. C. List of targeted pathway and protein class assays. Number in parentheses is the number of cysteines in the target list. D. Hit counts from the four assays. E. Dose-response curves from different pathways exemplifying the superior potency of E1853 over KB02 and KB05. F. Dose-response curves for TXNDC12C66. G. Energy-minimized structure of E390 bound to C66 on TXNDC12.

References

    1. Shuken S. R. “An Introduction to Mass Spectrometry-Based Proteomics.” J. Proteome Res. 2023, 22, 2151–2171. - PubMed
    1. Marx V. “Targeted proteomics.” Nature Methods 2013, 10, 19–22. - PubMed
    1. Mallick P.; et al. “Computational prediction of proteotypic peptides for quantitative proteomics.” Nature Biotechnol. 2007, 25, 125–131. - PubMed
    1. Pauletti B. A.; et al. “Typic: A Practical and Robust Tool to Rank Proteotypic Peptides for Targeted Proteomics.” J. Proteome Res. 2023, 22, 539–545. - PubMed
    1. Yu Q.; et al. “Sample multiplexing-based targeted pathway proteomics with real-time analytics reveals the impact of genetic variation on protein expression.” Nature Comm. 2023, 14, 555.

Publication types

LinkOut - more resources