[Preprint]. 2025 Sep 20:2025.09.19.677444.
doi: 10.1101/2025.09.19.677444.

Cortical tension as a mechanical barrier to safeguard against premature differentiation during neurogenesis

Affiliations

Cortical tension as a mechanical barrier to safeguard against premature differentiation during neurogenesis

Daniel Halperin et al. bioRxiv. .

Abstract

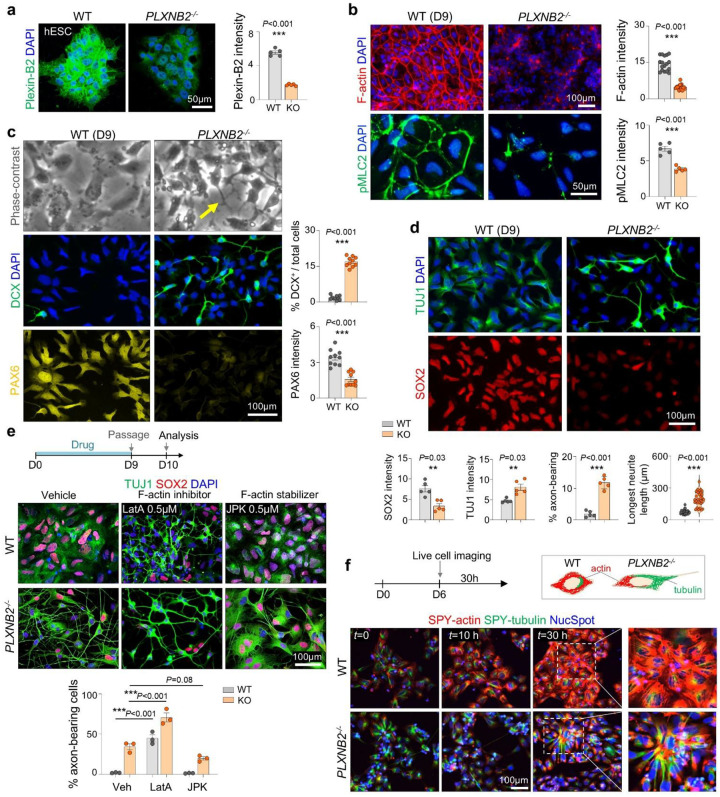
Neuronal differentiation requires coordinated gene reprogramming and morphodynamic remodeling. How mechanical forces integrate with nuclear gene programs during neurogenesis remains unresolved. Here, we identify cortical tension as a mechanical barrier that safeguards against premature neuronal differentiation. Deletion of Plexin-B2, a guidance receptor controlling actomyosin contractility, lowers this barrier, enabling neurite outgrowth and accelerating neuronal lineage commitment. We show that coupling of extrinsic differentiation cues with intrinsic morphodynamics is essential for stabilizing neuronal fate and that cortical barrier and epigenetic barrier act in concert to regulate developmental timing. In cerebral organoids, Plexin-B2 ablation triggered premature cell-cycle exit and differentiation, resulting in progenitor pool depletion and neuroepithelial disorganization, phenotypes echoing intellectual disability in patients with rare pathogenic PLXNB2 variants. Our studies demonstrate that cortical tension functions as mechano-checkpoint that regulates the onset of neurogenesis. Lowering this barrier may provide a strategy to accelerate induced neuron generation and maturation for CNS disease modeling.

Keywords: Cerebral organoid; Cortical barrier; Corticogenesis; Induced neuron; Neurodevelopment; Neuronal differentiation; Plexin-B2.


Conflict of interest statement

Competing interests R.H.F, H.Z., S.K., X.L, and Z.Y. are named inventors of technology related to anti-Plexin-B2 antibodies. This technology is the subject of a patent application filed by the Icahn School of Medicine at Mount Sinai. Other authors declare that they have no competing interests.

Figures

Figure 1.
Figure 1.. Progressive decline of cortical actin tension during neuronal differentiation.
a) Schematic of the dual-SMAD inhibition (SMADi) protocol to generate induced neurons. b-d) Progressive decrease of F-actin and pMLC2 and reciprocal increase of TUJ1 expression along iN differentiation process. Graphs represent mean ± SEM; n = 3 cultures for each condition; two-tailed nested t-test. e) Molecular dynamics simulation of neurite morphogenesis with varying membrane-actin attraction energy (U3; high = 30.0 vs. low = 3.0) and fixed membrane tension (κ00 = 500). Lower U3 facilitated dynamic protrusions resembling neurite extension. f) Quantification of simulated neurite projection length as a function of U3, with κ00 fixed at 10. Bar graphs represent mean ± SEM, one-way ANOVA with Dunnett’s multiple-comparison test. Intermediate U3 values promoted maximal extension, while very high or low U3 restricted membrane deformation and neurite protrusions. Contour plots below show representative simulated cell morphologies. g) Model: Cortical actin functions as a structural barrier restricting premature neurite projections.
Figure 2.
Figure 2.. Lowering cortical tension accelerates neurite formation.
a) IF showing loss of Plexin-B2 protein in PLXNB2−/− hESCs. n = 5 independent cultures per condition; unpaired two-tailed t-test. Bar graphs represent mean ± SEM. b) At D9 of differentiation, PLXNB2−/− cells displayed reduced cortical F-actin and pMLC2 compared with WT. n = 5 independent cultures per condition, two-tailed nested t-test. c) Phase-contrast (top) and IF (bottom) images at D9. PLXNB2−/− cells formed elongated projections (arrows) and showed increased DCX with reduced PAX6 compared with WT. n = 10 fields across two independent cultures; unpaired two-tailed t-test. d) IF for TUJ1 and SOX2 at D9. PLXNB2−/− cells showed increased TUJ1 and reduced SOX2. Each data point represents the mean of multiple fields of view from two independent cultures; two-tailed nested t-test. Bar graphs represent mean ± SEM. e) Schematic and representative IF images from epistasis analysis. Latrunculin A (LatA, 0.5 μM) reduced cortical F-actin and promoted neurite protrusions in WT cells, mimicking Plexin-B2 knockout. Conversely, jasplakinolide (JPK, 0.5 μM) stabilized F-actin and suppressed projections in PLXNB2−/− cells, restoring SOX2 expression. n = 3 images per condition; one-way ANOVA with Tukey’s test. Bar graphs represent mean ± SEM. f) Live-cell imaging of D6 cells labeled with NucSpot, SPY-tubulin, and SPY-actin over 30 hours. WT cells progressively reinforced cortical F-actin without protrusions, whereas PLXNB2−/− cells showed diminished cortical actin and long tubulin-based projections.
Figure 3.
Figure 3.. Single-nucleus transcriptomics confirms accelerated neuronal differentiation of PLXNB2−/− cells.
a) UMAP embedding of snRNA-seq data from D9 cells (n = 3 replicates per genotype). WT cells segregated into clusters enriched for radial glia (RG), neural progenitors (NPCs), and ESC-like states, whereas KO cells aligned with differentiated neuronal clusters. b) Feature plots showing expression of NPC and neuronal markers. c) Expression of representative marker genes across D9 subclusters. d) Volcano plot of differentially expressed genes (DEGs; PLXNB2−/− vs. WT), with selected genes highlighted. e) Bubble plot of enriched pathways upregulated in D9 PLXNB2−/− cells. f) ENRICHR GO enrichment analysis of DEGs for categories of biological process (BP), cellular component (CC), and molecular function (MF), color-coded by theme. g) Violin plots showing downregulation of actin cytoskeleton–associated genes in PLXNB2−/− cells. h) Heatmap of DEGs grouped by functional categories, across three replicates per genotype. i) Ingenuity Pathway Analysis (IPA) network summary. Growth factor signaling pathways were broadly suppressed, while PTEN was activated in PLXNB2−/− cells. j) Predicted upstream regulators (IPA) of DEGs in PLXNB2−/− vs. WT cells. k) Developmental stage scoring against human cortex gene signatures (Velmeshev et al., 2023). D9 WT cells aligned with 2nd-3rd trimester profiles, whereas PLXNB2−/− cells shifted toward postnatal signatures.
Figure 4.
Figure 4.. Function-blocking nanobodies against Plexin-B2 accelerate neuronal differentiation.
a) Workflow for generating anti-Plexin-B2 (PB2) nanobodies (Nbs). Camelids were immunized with recombinant extracellular domain of human PB2 protein, followed by phage display to isolate high-affinity VHHs, which were fused to human Fc (hFc). b) Experimental design. VHH-Fc Nbs (10 μg/ml) were added one day before iN protocol. c) Representative images showing reduced cortical F-actin, increased DCX and TUJ1, and decreased SOX2 in D10 cells treated with two independent anti-PB2 Nbs compared with control or no Nb. d) Quantification of marker expression. Each dot represents the mean of a field of view. n = 5 cultures for each condition; one-way ANOVA with Dunnett’s multiple-comparison test. Bar graphs represent mean ± SEM.
Figure 5.
Figure 5.. Matching external cues with intrinsic morphodynamics safeguards neuronal lineage commitment.
a) Standard forebrain and midbrain neuronal differentiation protocols. At D36, WT cells generated dense networks of TUJ1+ axon-bearing neurons, whereas PLXNB2−/− cells displayed aberrant morphologies. b) Accelerated protocol. After passage at D9, cells were switched directly to maturation medium, bypassing the differentiation media step. By D18a, PLXNB2−/− cells developed dense networks of TUJ1+ axon-bearing neurons, while WT cells retained progenitor-like morphology. c) IF comparison of neuronal markers and morphology in D36 WT (standard protocol) and D18a PLXNB2−/− (accelerated protocol) cells. d) UMAP embedding of D18a PLXNB2−/− and D36 WT iNs, showing segregation by genotype and forebrain vs. midbrain protocols. e) Feature plots showing shared neuronal markers across subclusters and genotypes. f) Transcriptional profiling revealed comparable expression of core neuronal/axonal markers between D36 WT and D18a PLXNB2−/− cells, but lower expression of functional genes in the latter. g) Experimental timeline and IF images show co-culture of iNs with GFAP+ astrocyte lawns to promote maturation. h) Multi-electrode array (MEA) recordings. PLXNB2−/− cells after maturation exhibited higher firing rates and synchrony index than WT cells (n = 6 cultures per condition; one-way ANOVA with Dunnett’s correction). Bar graphs represent mean ± SEM. i) Heatmap of epigenetic regulators shows convergent transcriptional shifts of D36 WT and D18a PLXNB2−/− iNs relative to D9 WT cells. D9 PLXNB2−/− cells already exhibited a similar shift, indicating accelerated epigenetic reprogramming. j) D9 PLXNB2−/− cells showed elevated nuclear TET3 compared with D9 WT, reaching levels comparable to D36 WT. n = 5 fields from 2 independent experiments for each condition, nested one-way ANOVA with Tukey’s multiple-comparison test. k) D9 PLXNB2−/− cells exhibited precocious expression of lamin A/C, similar to D36 WT and D18a PLXNB2−/− iNs. l) Working model: Plexin-B2-mediated cortical tension act as a mechanical barrier alongside an epigenetic barrier to prevent precocious differentiation.
Figure 6.
Figure 6.. Plexin-B2 deficiency disrupts cortical development in human cerebral organoids.
a) IF of day 42 cerebral organoids shows broad Plexin-B2 expression in the ventricular zone (VZ; SOX2+) and cortical plate (CP), including FAM107A+ outer radial glia. b) IF of human fetal brain at 23 gestational weeks reveals broad Plexin-B2 expression in the SOX2+ germinal matrix and developing cortex, including FAM107A+ cells. c) Representative images and quantification of organoid diameters show reduced size in PLXNB2−/− organoids (WT, n = 15; KO, n = 16). Bar graphs represent mean ± SEM; unpaired two-tailed Student’s t-test. d) Left, IF demonstrates loss of Plexin-B2 in d42 KO organoids. Right, Western blot confirms Plexin-B2 ablation, with β-actin as loading control. Quantification from n = 3 independent experiments. unpaired two-tailed Student’s t-test. e) Left, IF reveals disrupted architecture of KO organoids with shrinkage of SOX2+ VZ. Right, Western blot and heatmap show reduced SOX2 and increased TUJ1. n = 3 independent cultures per condition; unpaired two-tailed Student’s t-test. f) KO organoids exhibit expanded but disorganized DCX+ neuroblasts and reduced PAX6+ progenitors. g) Disrupted neuroepithelial organization in KO organoids, with diffuse β-catenin, N-cadherin, and reduced apical F-actin enrichment. h) WT organoids contain a dense apical ring of proliferating Ki67+/pH3+ cells, which was reduced and mislocalized in KO organoids. i) EdU pulse-chase assay design (30 min pulse, 24 h chase). KO organoids showed increased cell-cycle exit (i.e. fraction of Ki67 cells among EdU+ cells). n = 6 fields from 3 independent organoids for each condition; unpaired two-tailed t-test. j) Model: Plexin-B2 maintains progenitor pool homeostasis by regulating the timing of neuronal differentiation. Loss of Plexin-B2 leads to premature cell-cycle exit, precocious neuronal differentiation, and progenitor depletion.
Figure 7.
Figure 7.. Accelerated neurogenic trajectory in PLXNB2−/− organoids is accompanied by lineage instability.
a) UMAP embedding of snRNA-seq profiles from day 42 cerebral organoids (n = 3 replicates per genotype). EN, excitatory neurons; Mes, mesenchymal-like; Epen, ependymal-like; SCP, Schwann cell precursor/neural crest-like. b) Stacked bar plots show loss of RG (sc0) and expansion of subplate-like (sc3) and maturing EN (sc6) populations in PLXNB2−/− organoids, reflecting accelerated neurogenesis and lineage imbalance. c) Dot plot showing expression of marker genes across annotated subclusters. d) Feature plots highlighting distinctive marker gene expression in WT vs. PLXNB2−/− subclusters. e) Volcano plot of DEGs (adj. P < 0.05, log2FC > 1) with selected genes labeled. f) GO enrichment analysis of DEGs, grouped by biological process (BP), cellular component (CC), and molecular function (MF), color-coded by theme. g) Heatmap showing functional gene groups: WT organoids upregulated mature neuronal and synaptic genes, whereas PLXNB2−/− organoids upregulated stromal/EMT-associated genes, indicating lineage instability and aberrant mesenchymal-like states. h) IPA network analysis revealed broad suppression of progenitor/neuronal regulatory pathways in KO organoids, with limited activation of developmental branching and stress-response regulators. i) Predicted upstream regulators of DEGs, including suppression of proliferation- and neurogenesis-associated TFs and activation of senescence and stress regulators. j) Transcriptome scoring against human cortical developmental signatures (Velmeshev et al., 2023) with WT organoid cells primarily aligning with 2nd trimester signatures, whereas PLXNB2−/− organoids also align with postnatal/adult signatures, indicating accelerated developmental age. k) Comparative IPA of PLXNB2−/−vs. WT in D36 iNs and d42 organoids revealed convergent alterations in neuronal differentiation and brain morphology pathways, supporting both models for Plexin-B2-linked neurodevelopmental defects. l) Model: Plexin-B2 enforces a cortical mechanical barrier integrated with an epigenetic barrier to safeguard the timing of neuronal differentiation. Loss of Plexin-B2 lowers this barrier, leading to premature epigenetic reprogramming, accelerated neurogenesis, and lineage instability.

References

    1. Kriegstein A., and Alvarez-Buylla A. (2009). The glial nature of embryonic and adult neural stem cells. Annu Rev Neurosci 32, 149–184. 10.1146/annurev.neuro.051508.135600. - DOI - PMC - PubMed
    1. Taverna E., Götz M., and Huttner W.B. (2014). The cell biology of neurogenesis: toward an understanding of the development and evolution of the neocortex. Annu Rev Cell Dev Biol 30, 465–502. 10.1146/annurev-cellbio-101011-155801. - DOI - PubMed
    1. Guillemot F. (2007). Spatial and temporal specification of neural fates by transcription factor codes. Development 134, 3771–3780. 10.1242/dev.006379. - DOI - PubMed
    1. Imayoshi I., and Kageyama R. (2014). bHLH factors in self-renewal, multipotency, and fate choice of neural progenitor cells. Neuron 82, 9–23. 10.1016/j.neuron.2014.03.018. - DOI - PubMed
    1. Hardwick L.J., Ali F.R., Azzarelli R., and Philpott A. (2015). Cell cycle regulation of proliferation versus differentiation in the central nervous system. Cell Tissue Res 359, 187–200. 10.1007/s00441-014-1895-8. - DOI - PMC - PubMed

Publication types

LinkOut - more resources