[Preprint]. 2025 Sep 20:2025.09.17.676846.
doi: 10.1101/2025.09.17.676846.

A cross model spatial and single-cell atlas reveals the conserved involvement of osteopontin in polycystic kidney disease

Affiliations

A cross model spatial and single-cell atlas reveals the conserved involvement of osteopontin in polycystic kidney disease

Sarah J Miller et al. bioRxiv. .

Abstract

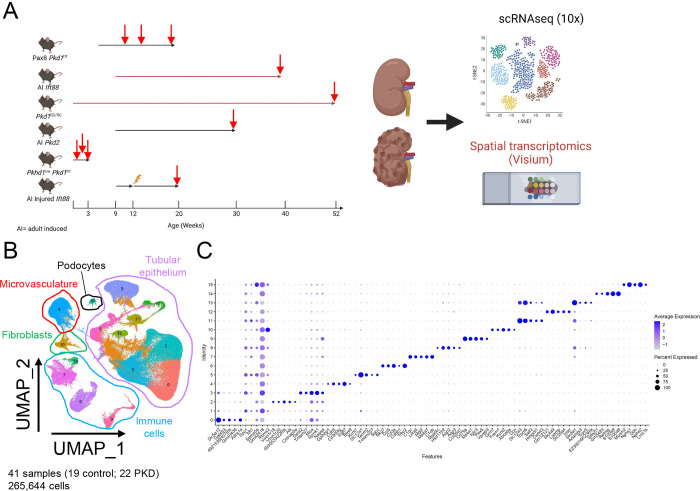
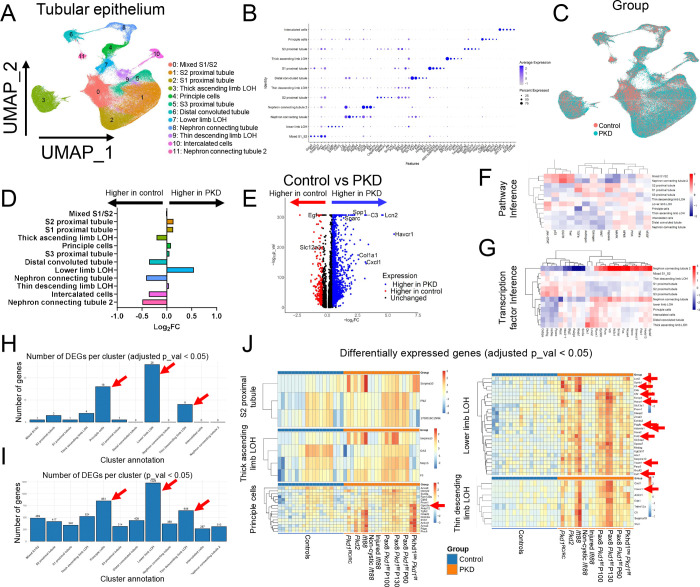
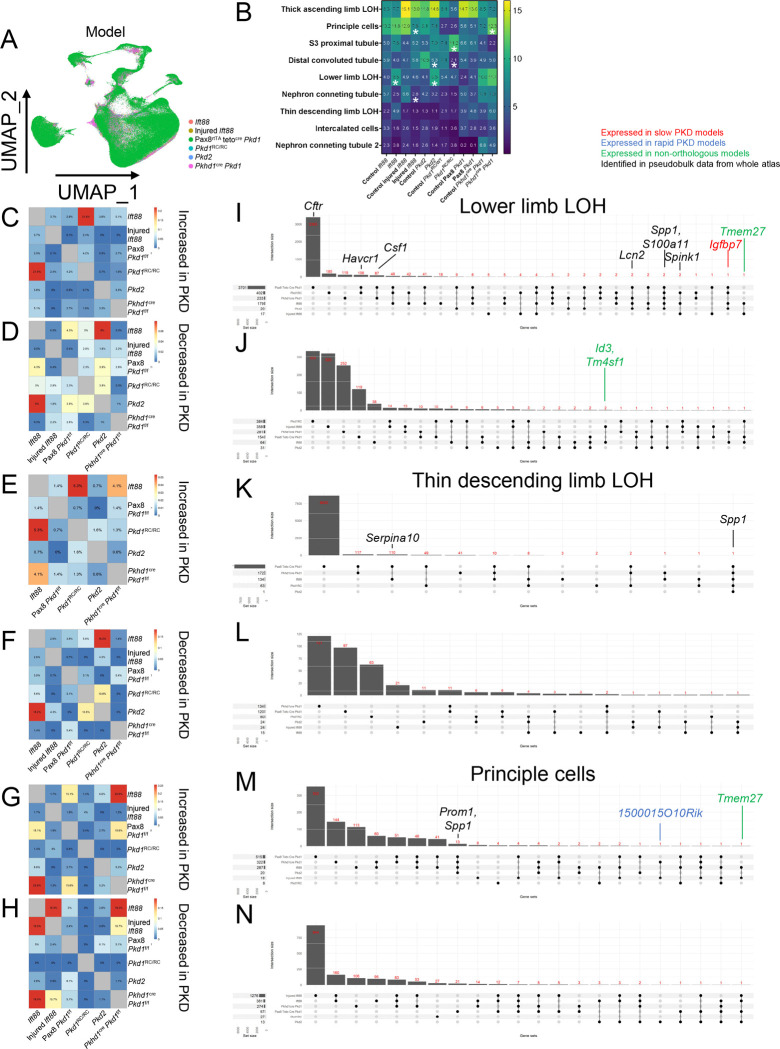
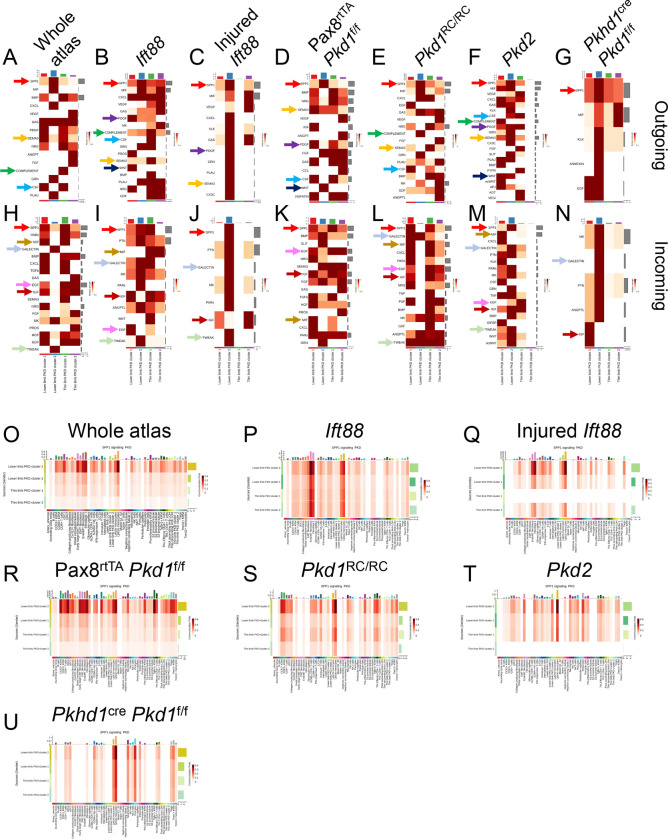
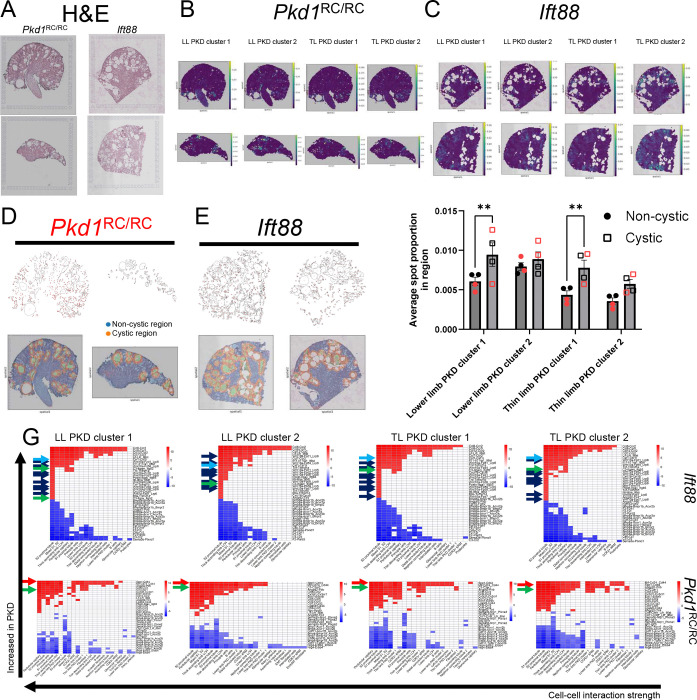
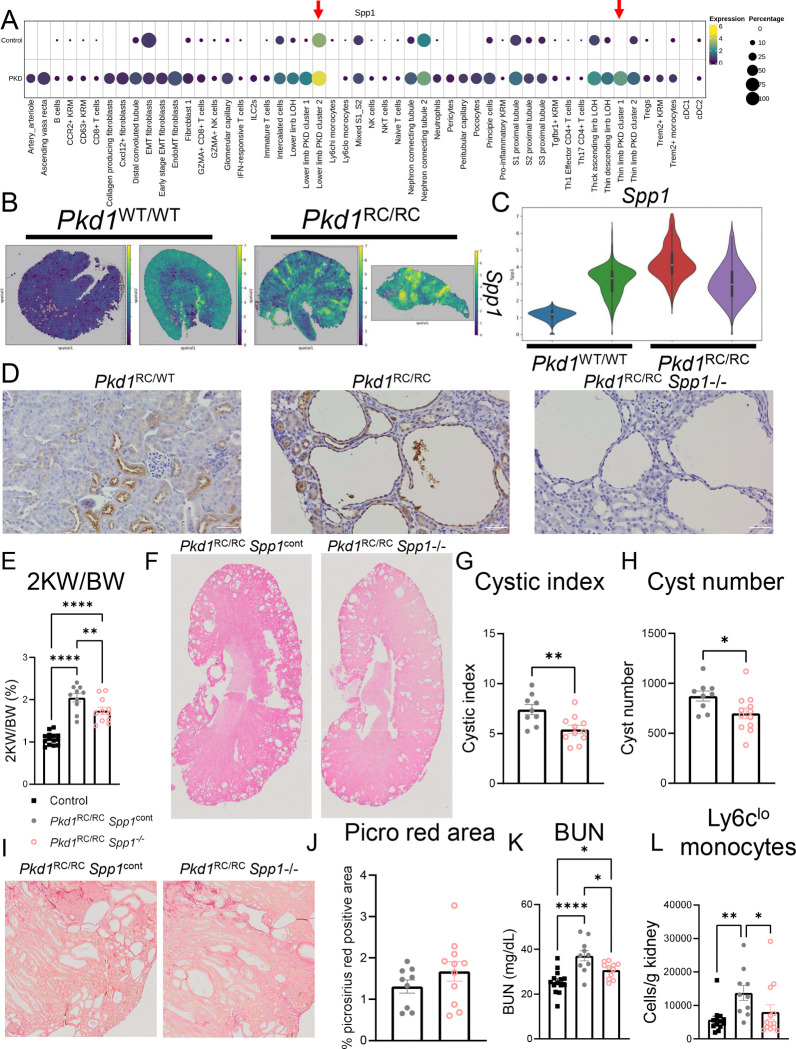
Polycystic kidney disease (PKD) arises from mutations in cilia-associated genes, such as PKD1 and PKD2, expressed in renal epithelial cells, leading to progressive kidney dysfunction and end-stage kidney disease (ESKD). PKD patients exhibit significant heterogeneity in disease progression, largely due to genetic and environmental modifiers. Like patients, mouse models of PKD also exhibit significant heterogeneity with regards to the gene mutated, age of disease onset, and rate of disease progression. To elucidate the cellular and molecular consequences of these variables, we constructed an integrated single-cell and spatial transcriptomics atlas across mouse models of PKD, mapping changes in cell type composition, gene expression, and intercellular signaling networks across the whole atlas and within individual models. Consistently across models, single cell RNA sequencing (scRNAseq) data revealed increased Spp1 (osteopontin) expression and signaling from PKD-enriched clusters to Ly6clo monocytes. Global deletion of Spp1 in Pkd1 RC/RC mice resulted in reduced cyst severity, improved kidney function, and reduced Ly6clo monocyte numbers, suggesting that SPP1 signaling to Ly6clo monocytes promotes PKD progression. We also created a freely available, searchable website (https://bmblx.bmi.osumc.edu/scPKD/) that can be used to identify cross- and intra-model specific changes in gene expression, guiding researchers to new therapeutic targets for treating PKD.

Keywords: Polycystic kidney disease; macrophages; osteopontin; single cell RNA sequencing; spatial transcriptomics.


Figures

Figure 1.
Figure 1.. Single cell atlas of PKD in mice.
(A) Schematic of experimental design used to generate the single cell atlas of PKD in mice. Red arrows indicate time points of harvest. (B) Uniform Manifold Approximation and Projection (UMAP) of all cells collected from mouse models of PKD. (C) Dotplot showing the top 5 markers of each cluster from the whole atlas. Pax8cre Pkd1f/f model (8 control samples, 9 PKD samples; all male), adult induced (AI) Ift88 model (2 controls, 2 PKD; all female), Pkd1RC/RC model (2 controls, 3 PKD; 3 males [1 control, 2 PKD], 2 females [1 control, 1PKD]), AI Pkd2 (2 controls, 2 PKD; all female), Pkhd1cre Pkd1f/f (3 controls, 3 PKD; mix of males and females), AI injured Ift88 (4 controls [2 sham operated Ift88, 2 injured cre negative control], 2 PKD; all female).
Figure 2.
Figure 2.. Analyses of scRNAseq data from the nephron.
(A) UMAP of tubular epithelial cells subclustered from Figure 1. (B) Dotplot showing the top 5 markers of each cluster of cells. (C) UMAP of tubular epithelial cells based on experimental group, (D) Quantification of cluster abundance in control and PKD samples from whole atlas. (E) DEGs in all tubular epithelial cells when comparing control and PKD samples. (F, G) Pathway and transcription factor inference from DecoupleR. (H,I) Quantification of the number of DEGs in each cluster (control vs PKD) in pseudobulked scRNAseq data determined using DESeq2. (J) DEGS between control and PKD tubular cell clusters.
Figure 3.
Figure 3.. Analysis of cluster abundance and gene expression based on genetic mutation and rate of PKD progression.
(A) UMAP of tubular epithelial cells based on genetic mutation (orthologous vs non-orthologous mutation). (B) Quantification of cluster abundance based on genetic mutation. (C) UMAP of tubular epithelial cells based on rate of PKD progression (slow vs rapid). (D) Quantification of cluster abundance based on rate of PKD progression. (E,F) Venn diagram showing unique and shared DEGs that are (E) increased or (F) decreased in the lower limb LOH based on the genetic mutation. (G) Bubble plot of the top 5 GO pathways that are increased or decreased in lower limb LOH based on genetic mutation. (H,I) Venn diagram showing unique and shared DEGs that are (H) increased or (I) decreased in the lower limb LOH based on the rate of PKD progression. (J) Bubble plot of the top 5 GO pathways that are increased or decreased in lower limb LOH based on the rate of PKD progression.
Figure 4.
Figure 4.. Model level analysis of cluster abundance and gene expression reveals consistent upregulation of Spp1 in PKD.
(A) UMAP of tubular epithelial cells based on individual models. (B) Quantification of cluster abundance in individual models. (C-H) Jaccard indices of intersected genes that were increased or decreased in the lower limb LOH, thin descending limb LOH, and principle cells of individual PKD models. (I-N) Upset plot showing shared genes that are increased or decreased across models. Genes highlighted in red are increased in all slow PKD models; genes highlighted in blue are increased in all rapid PKD models; genes highlighted in green are enriched in all non-orthologous models; genes highlighted in black were identified in pseudobulk analysis.
Figure 5.
Figure 5.. PKD enriched clusters across mouse models.
(A) Quantification of subsetted, high resolution cluster abundance in each nephron segment. Data is plotted as Log2FC in relation to non-cystic controls. (B) UMAP showing high resolution clusters and groups in lower limb LOH. (C) Quantification of subsetted, high resolution lower limb LOH cluster. Two segments were greater than two-fold increased in PKD samples. (D) UMAP showing high resolution clusters and groups in thin descending limb LOH. (E) Quantification of subsetted, high resolution thin descending limb LOH cluster. Two segments were greater than two-fold increased in PKD samples. (F,G) Re-annotated high resolution clusters from (F) lower limb LOH and (G) thin limb LOH. (H,I) Quantification of PKD-enriched cluster abundance in (H) lower limb LOH and (I) thin limb LOH from individual models in relation to model specific, non-cystic controls. (J,K) Volcano plot and gene set enrichment analysis (GSEA) of genes expressed in each PKD-specific cluster from the lower limb LOH. (L,M) Volcano plot and gene set enrichment analysis (GSEA) of genes expressed in each PKD-specific cluster from the thin limb LOH.
Figure 6.
Figure 6.. Cellchat analysis of cell-cell communication in PKD-enriched clusters at the whole atlas and model level reveals elevated SPP1 signaling to monocytes.
(A-G) Top outgoing signaling pathways from PKD enriched clusters at the whole atlas and model level. Arrows indicate pathways that are conserved across multiple models. (H-N) Top incoming signaling pathways to PKD enriched clusters at the whole atlas and model level. Arrows indicate pathways that are conserved across multiple models. (O-U) SPP1 signaling from PKD enriched clusters to all other cell types at the whole atlas or model specific level.
Figure 7.
Figure 7.. Spatial transcriptomics shows that SPP1 signaling is increased in the Pkd1RC/RC, but not Ift88 model.
(A) H&E images of PKD samples that were subjected to spatial transcriptomics. (B,C) TACCO deconvolution of PKD enriched clusters in (B) Pkd1RC/RC and (C) Ift88 mice. (D,E) Cystic and non-cystic regions in Pkd1RC/RC and Ift88 kidneys identified using ImageJ. (F) Quantification of the proportion of each PKD-enriched cluster that was found in cystic or non-cystic regions in Pkd1RC/RC and Ift88 mice. Proportions from Pkd1RC/RC mice are shown in red. (G,H) Top 50 ligand-receptor pairs between PKD enriched clusters and other cell types. Data was normalized to non-cystic kidneys.
Figure 8.
Figure 8.. Loss of Spp1 improves PKD severity and reduces Ly6clo monocyte number in the Pkd1RC/RC model.
(A) Dotplot showing expression of Spp1 in all cell types of Pkd1RC/RC mice. (B) Spp1 expression in Pkd1WT/WT and Pkd1RC/RC sections. (C) Quantification of Spp1 expression in Pkd1WT/WT and Pkd1RC/RC sections. (D) Immunohistochemistry staining of osteopontin in Pkd1RC/WT and Pkd1RC/RC sections. Images were taken using 20X magnification. (E) Quantification of two kidney weight to body weight (2KW/BW) ratio in Pkd1RC/RC Spp1cont and Pkd1RC/RC Spp1−/− mice at one year of age. (F-H) H&E stained images of Pkd1RC/RC Spp1cont and Pkd1RC/RC Spp1−/− mice along with quantification of (G) cystic index and (H) cyst number. (I,J) Picrosirius red stained sections (I) and quantification (J). (K) Quantification of kidney function as measured by blood urea nitrogen (BUN). (L) Flow cytometry quantification of Ly6clo monocyte number. One way ANOVA (B,I), Student’s T-test (all others). *P <0.05, **P <0.01; ***P <0.001; ****P <0.0001. Control (Pkd1RC/WT) Spp1cont= 14 mice, Pkd1RC/RC Spp1cont= 10 mice, Pkd1RC/RC Spp1−/−= 12 mice; 36 total Pkd1RC/RC mice.

References

    1. Porath B, Gainullin VG, Cornec-Le Gall E, et al. Mutations in GANAB, Encoding the Glucosidase IIalpha Subunit, Cause Autosomal-Dominant Polycystic Kidney and Liver Disease. Am J Hum Genet 2016; 98: 1193–1207. - PMC - PubMed
    1. Harris PC, Rossetti S. Determinants of renal disease variability in ADPKD. Adv Chronic Kidney Dis 2010; 17: 131–139. - PMC - PubMed
    1. Cornec-Le Gall E, Torres VE, Harris PC. Genetic Complexity of Autosomal Dominant Polycystic Kidney and Liver Diseases. J Am Soc Nephrol 2018; 29: 13–23. - PMC - PubMed
    1. Benz EG, Hartung EA. Predictors of progression in autosomal dominant and autosomal recessive polycystic kidney disease. Pediatr Nephrol 2021; 36: 2639–2658. - PMC - PubMed
    1. Ma M, Tian X, Igarashi P, et al. Loss of cilia suppresses cyst growth in genetic models of autosomal dominant polycystic kidney disease. Nat Genet 2013; 45: 1004–1012. - PMC - PubMed

Publication types