[Preprint]. 2025 Sep 21:2025.09.18.677130.
doi: 10.1101/2025.09.18.677130.

Single-cell quantification of the microbiota by flow cytometry: MicFLY

Affiliations

Single-cell quantification of the microbiota by flow cytometry: MicFLY

Christine M Tin et al. bioRxiv. .

Abstract

The intestinal microbiota regulates multiple host functions, including digestion and immune development. Our knowledge of the microbiota has been shaped by available technology that primarily measures relative abundance. However, understanding the basis of shifts in microbiota composition requires single cell, absolute abundance measurements. In response to this problem, we developed Microbiota Flow Cytometry (MicFLY), a single cell technology that directly quantifies and characterizes total bacterial abundances with species-level resolution in the microbiota. Using MicFLY, we can identify all major intestinal taxa, discriminate live from dead bacteria, perform single cell measurements of heterogeneous bacterial mRNA expression and concurrently quantify Immunoglobulin (Ig) A and G binding to intestinal bacteria. Using longitudinal species-resolved, quantitative analysis of the preterm infant microbiota, we identify that E. coli unbound by IgG and IgA associates with the development of necrotizing enterocolitis. The application of MicFLY single cell technology permits measurement of the microbiota at a finer scale and with deeper mechanistic understanding of compositional changes.


Conflict of interest statement

DECLARATION OF INTERESTS TWH, CMT, DAA and WHD have patents on the MicFLY technology in this manuscript. TWH previously consulted for Keller Postman LLC.

Figures

Figure 1 |
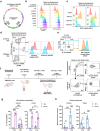
Figure 1 |. MicFLY single cell technology identifies diverse, live bacteria with high taxonomic resolution.
a, Overview of MicFLY workflow (made with BioRender). b, Representative confocal microscopy images of E. coli (magenta; Enterobacteriaceae probe/B2-Alexa Fluor 594) and S. aureus (cyan; Bacilli probe/B4-Alexa Fluor 488) after staining by MicFLY protocol. c, Flow cytometry identification of in vitro grown bacteria in a mixed sample (E. coli, S. aureus, and B. breve) after MicFLY staining. Cells are gated on total bacteria (Eub338 probe/B1-Alexa Fluor 647) prior to identification of individual taxa. Experimental design graphic made with BioRender. d, Discrimination of pure cultures of K. pneumoniae and K. oxytoca using species-specific probes by MicFLY. Cells are gated on total bacteria (Eub338 probe/B1-Alexa Fluor 647). e, Multiplexed detection of 20 in vitro cultured bacterial species from diverse phyla representing the human gut microbiome by MicFLY staining. Each column represents signal from a unique probe across different taxa. All probes were tested in the same panel and stained on individual taxa. Cells are gated on total bacteria (as in c). f, Validation of viability dye on pure culture bacteria analyzed with MicFLY. In vitro cultured Veillonella parvula bacteria (Negativicutes probe/B5-Alexa Fluor 514) are heated to 95°C for 20 minutes prior to incubation with fixable viability dye eFluor780 and compared to non-heat killed sample. Flow cytometry plots (left) indicate gating strategy and histograms (right) indicate staining intensity with viability dye. g, Validation of viability dye on bacteria from fecal samples analyzed with MicFLY. Heat-killed and non-heat killed bacteria isolated from specific-pathogen free (SPF) C57BL/6 mouse stool are compared. Flow plots (left) indicate gating strategy and histograms (right) indicate viability dye staining to all bacteria (Eubacteria combined probe set/B5-AF514; center right) or Bacteroidales (Bacteroidales probe set/B17-Alexa Fluor 405; far right). All flow cytometry analyses show representative plots from multiple independent experiments. Numbers in plots represent percentage of events inside the gate. All histograms are normalized to mode.
Figure 2 |
Figure 2 |. MicFLY quantification and viability assessment of a predefined microbial consortia.
a, MicFLY staining and spectral flow cytometry resolves all taxa within a defined bacterial community. Fecal samples were isolated from gnotobiotic Eα16/NOD mice (n = 5; ages 4–20 weeks old) colonized with a nine-member (PedsCom) bacterial community (described in image; left). Shown are representative flow plots from MicFLY analysis at the family-level, gated on total bacterial cells using the Eubacteria combined probe set/B17-Alexa Fluor 405. b, The composition of PedsCom fecal samples was analyzed by MicFLY, quantitative PCR and 16S rRNA gene amplicon sequencing (16S-seq; V4 region). Stacked bar charts depict relative abundance calculated by each method. To calculate relative abundance for qPCR, the number of counts for a taxon was divided by the sum of counts for all measured taxa. PedsCom relative abundance measured by MicFLY was calculated the same way. 16S-seq relative abundance data were processed using QIIME2. c, Principal coordinates analysis (PCoA; Bray-Curtis using MicrobiomeAnalyst) depicts beta diversity measurements for each microbiota measurement method. Ellipses represent 95% confidence intervals for each group, and statistical comparisons made using pairwise PERMANOVA with multi-testing adjustments based on Benjamini-Hochberg (FDR). p < 0.001 (**); ns, not significant (p ≥ 0.05) d, Absolute abundances of each bacterial family measured by MicFLY and qPCR from paired stool samples for five mice. Bacterial counts normalized to stool weight (mg), and statistical comparisons performed using a paired two-tailed t-test. Dashed line represents limit of detection for that taxon, calculated as mean absolute abundance in stool from germ-free mice (n = 4). p < 0.05 (*). e, Microbiota viability as measured by MicFLY. Statistical significance assessed using one-way ANOVA with Tukey’s multiple comparisons test. Bars show mean± SEM. p < 0.05 (*), p < 0.01 (**), p < 0.0001 (****). Group with four asterisks is significantly different from every other group. DNA extracted from one stool pellet for each mouse (five mice total) was used for both qPCR and 16S-seq. A second stool pellet from each mouse was tested by MicFLY. For MicFLY and qPCR, each pellet was tested twice in two independent runs, and data reflect the average relative/absolute abundance (b-d) or average viability (e) of both runs. For 16S-seq, data reflect relative abundances from a single sequencing experiment (b, c).
Figure 3 |
Figure 3 |. MicFLY enables single-cell quantification of bacterial mRNA expression in vitro and in vivo.
a, Plasmid map of pBAD promoter-driven arabinose-inducible GFP mRNA with kanamycin resistant gene. b, GFP mRNA and protein levels in E. coli induced with increasing concentrations of arabinose (% w/v), measured with MicFLY. mRNA-targeted probes were used to detect GFP transcripts, while GFP reporter protein was directly measurable by flow cytometry. c, Dynamics of GFP mRNA expression over time in E. coli following arabinose induction (+) or removal (−), measured with MicFLY. d, Flow cytometric detection of mCherry mRNA and mCherry reporter protein in a Salmonella enterica serovar Typhimurium (Stm) strain carrying a genomically-encoded, constitutively expressed mCherry reporter protein, measured with MicFLY. Stm strain lacking mCherry was used as a control. mCherry transcripts were detected by MicFLY mRNA-targeted probes, while mCherry reporter protein was directly measurable by flow cytometry. e, Detection of Stm ompA mRNA in a mixed sample of in vitro cultured Stm and E. coli. f, Experimental design (left; made with BioRender) of in vivo ompA mRNA expression detection. 129X1/SvJ adult mice (n = 5–6 per time-point) were treated with streptomycin, then orally infected the next day with 2.5 × 10 CFU Stm. Stm-infected mice were sacrificed at either 4 hours post-infection (4 hpi) or 4 days post-infection (4 dpi) for MicFLY analysis of cecal and colonic contents. Representative flow plots (right) depict gating scheme and ompA mRNA expression for Stm or Bacilli. g, Microbiota composition in cecum and colon at 4 hpi and 4 dpi as measured by MicFLY. Graphs depict relative proportions of live Eubacteria+Stm+ and live Eubacteria+Bacilli+ populations. Bars show mean ± SEM. Each dot represents an individual mouse. h, Graphs depict the median fluorescence intensity (MFI) of ompA mRNA expression in live Eubacteria+Stm+ or live Eubacteria+Bacilli+ populations at 4 hpi and 4 dpi. Bars show average MFI ± SEM. Each dot represents an individual mouse. For in vitro tests (b-e), bacteria were gated on Eubacteria/B17-Alexa Fluor405+ Enterobacteriaceae/B2-Alexa Fluor 594+. Numbers in flow plots represent percentage of events inside the gate, and all histograms are normalized to mode. For in vivo experiments (f-h), two independent sets of mice were tested (set 1: n=3; set 2: n=2–3). Set 1 used probes for Eubacteria, Enterobacteriaceae, Stm, Lactobacillaceae (family-level), and ompA. Set 2 used probes for Eubacteria, Enterobacteriaceae, Stm, Bacilli (class-level), and ompA. For statistical analyses, Lactobacillaceae and Bacilli data were combined and reported as Bacilli. Statistical tests were performed using two-way ANOVA with Tukey’s multiple comparisons test. p < 0.05 (*), p < 0.01 (**), p < 0.001 (***), p < 0.0001 (****).
Figure 4 |
Figure 4 |. MicFLY reveals differences in IgA binding to microbiota in preterm infants fed mother’s own milk or donor milk.
a, Study design and sample overview. Graphs summarize longitudinally collected stool. The day-of-life (DOL) on which a sample was collected is shown by an individual dot. Colors indicate feeding group (pink = MOM, blue = DM), and each row corresponds to one infant. b, Gating strategy to identify IgA-bound bacteria with MicFLY. IgA+ gating was defined using isotype control antibody (goat anti-chicken IgY CF633). c, Absolute abundances of Eubacteria, Enterobacteriaceae, and Bacilli populations measured in MOM- and DM-fed infants and calculated by MicFLY. Bars represent average total counts ± SEM for pooled samples from DOL 10–21 for each infant. Each dot represents an individual infant. Statistical analyses use unpaired two-tailed Welch’s t-test. d, MicFLY measurements of percent IgA-bound bacterial taxa compared by feeding type. Aggregated data of all samples is shown. Box plots show median, interquartile range, and minimum to maximum values. Each dot represents a single sample. Statistical analyses use two-tailed unpaired Mann-Whitney test. e, ELISA measurements on total concentration of free IgA (ng of IgA per mg stool) compared between feeding type. Aggregated data of all samples is shown. Box plot shows median, interquartile range, and minimum to maximum values. Each dot represents a single sample. Statistical analyses use two-tailed unpaired Mann-Whitney test. f, Correlation between bacterial abundance (log-transformed) and percent IgA-bound bacteria within each taxon, measured by MicFLY. Best-fit line from simple linear regression is displayed; r and p-value from Spearman correlation. Each dot represents a single sample, and each color corresponds to an individual patient. Repeated colors indicate multiple samples per patient. For all statistical tests: p < 0.05 (*), p < 0.01 (**), p < 0.001 (***), p < 0.0001 (****). All analyses done on live cells only.
Figure 5 |
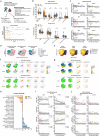
Figure 5 |. Species-resolved longitudinal antibody binding dynamics in preterm infants who develop NEC.
a, Study design and sample overview. Graphs summarize longitudinally collected stool. The day-of-life (DOL) on which a sample was collected is shown by an individual dot. Colors indicate patient group (orange = prospective NEC diagnosis, blue = control), and each row corresponds to one infant. b, Absolute abundance of Enterobacteriaceae and Bacilli species measured by MicFLY using genus/species-specific probes. Aggregated data of all samples is shown. Box plots show median, interquartile range, and minimum to maximum values. Statistical comparisons performed using unpaired two-tailed multiple Mann-Whitney tests with Holm-Sidak correction. c, Longitudinal correlation of day-of-life (DOL) and total bacterial counts (log-transformed) comparing NEC and control infants for amounts of Eubacteria+, Enterobacteriaceae+, and Bacilli+ bacteria measured by MicFLY. Best-fit line from simple linear regression is displayed, and shaded area represents 95% confidence interval; r and p-value from Spearman correlation. Each dot represents a single sample, and each color corresponds to an individual patient. Repeated colors indicate multiple samples per patient. d, UMAP projections of species-specific Enterobacteriaceae+ events as determined by MicFLY. Data was concatenated from all patients and timepoints. UMAPs depict species distribution across NEC and control groups. Plots generated using FlowJo’s UMAP plugin (5 nearest neighbors, minimum distance 0.1, 2 components) and visualized with Cluster Explorer. Each dot represents a single bacterial cell, which is color-coded according to species. e, UMAP projections of species-specific Bacilli+ events exactly as in panel d. f, Visualization of IgA or IgG binding intensity overlayed onto UMAP from d. Each dot represents a single bacterial cell; color scale reflects anti-IgA or anti-IgG fluorescence intensity, scaled from minimum to maximum within the dataset. Species-specific clusters (E. coli, K. aerogenes, K. pneumoniae, K. oxytoca, E. cloacae) are shown in separate cluster-level views. g, IgA or IgG binding intensity overlays for Bacilli+ populations, exactly as in panel f. h, Sorted feature loadings along Principal Component 3 (PC3) from Joint-Compositional Tensor Factorization (Joint-CTF) analysis using longitudinal absolute abundances of Enterobacteriaceae taxa and their antibody binding. Feature rankings for only the IgA/IgG-bound taxa are shown. Features are ordered by their PC3 coefficients, reflecting their relative association with NEC (orange) or control (blue). i, Longitudinal correlation of DOL and percent antibody-bound E. coli comparing NEC and control patients measured by MicFLY. Antibody binding is split between IgG- and IgA-bound bacteria, as indicated. Best-fit line from simple linear regression is displayed, and shaded area represents 95% confidence interval; r and p-value from Spearman correlation. Same samples and color coding as in panel c. j, Longitudinal display of absolute abundance for antibody-bound E. coli in NEC and control patients measured by MicFLY. Total numbers are shown for E. coli bound by IgA, IgG, or both. Same samples and color coding as in panel c. All analyses done on live cells only.

References

    1. Gopalakrishna K.P., Macadangdang B.R., Rogers M.B., Tometich J.T., Firek B.A., Baker R., Ji J., Burr A.H.P., Ma C., Good M., et al. (2019). Maternal IgA protects against the development of necrotizing enterocolitis in preterm infants. Nat Med 25, 1110–1115. 10.1038/s41591-019-0480-9. - DOI - PMC - PubMed
    1. Gevers D., Kugathasan S., Denson L.A., Vázquez-Baeza Y., Van Treuren W., Ren B., Schwager E., Knights D., Song S.J., Yassour M., et al. (2014). The treatment-naive microbiome in new-onset Crohn’s disease. Cell Host Microbe 15, 382–392. 10.1016/j.chom.2014.02.005. - DOI - PMC - PubMed
    1. Alekseyenko A.V., Perez-Perez G.I., De Souza A., Strober B., Gao Z., Bihan M., Li K., Methé B.A., and Blaser M.J. (2013). Community differentiation of the cutaneous microbiota in psoriasis. Microbiome 1, 31. 10.1186/2049-2618-1-31. - DOI - PMC - PubMed
    1. Ley R.E., Bäckhed F., Turnbaugh P., Lozupone C.A., Knight R.D., and Gordon J.I. (2005). Obesity alters gut microbial ecology. Proceedings of the National Academy of Sciences 102, 11070–11075. doi: 10.1073/pnas.0504978102. - DOI
    1. Turnbaugh P.J., Ley R.E., Mahowald M.A., Magrini V., Mardis E.R., and Gordon J.I. (2006). An obesity-associated gut microbiome with increased capacity for energy harvest. Nature 444, 1027–1031. 10.1038/nature05414. - DOI - PubMed

Publication types

LinkOut - more resources