[Preprint]. 2025 Sep 18:2025.04.25.650726.
doi: 10.1101/2025.04.25.650726.

Tulp3 quantitative alleles titrate requirements for viability, brain development, and kidney homeostasis but do not suppress Zfp423 mutations in mice

Affiliations

Tulp3 quantitative alleles titrate requirements for viability, brain development, and kidney homeostasis but do not suppress Zfp423 mutations in mice

Corinne A McCoy et al. bioRxiv. .

Abstract

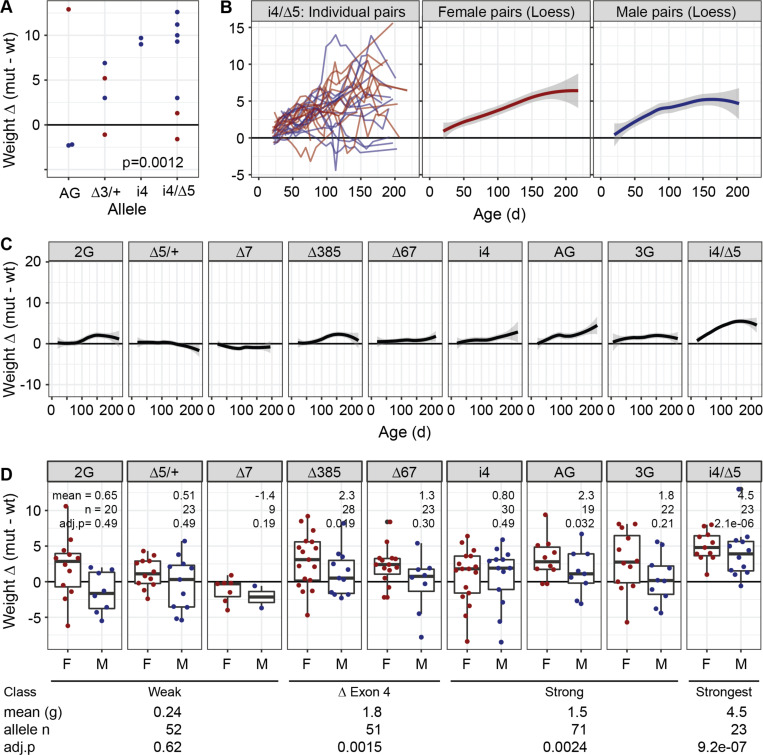
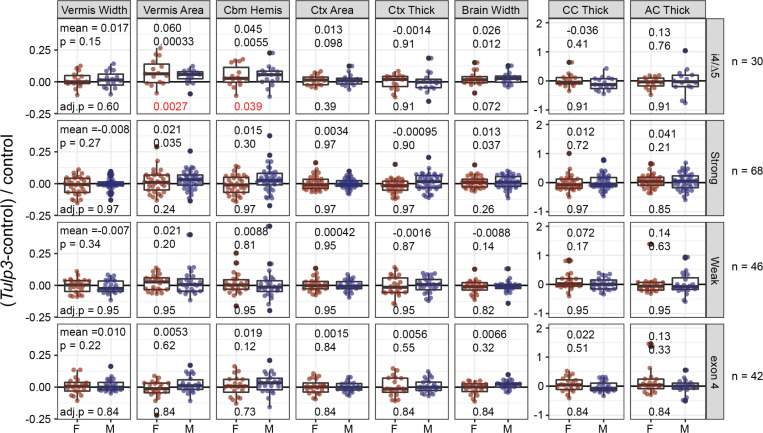
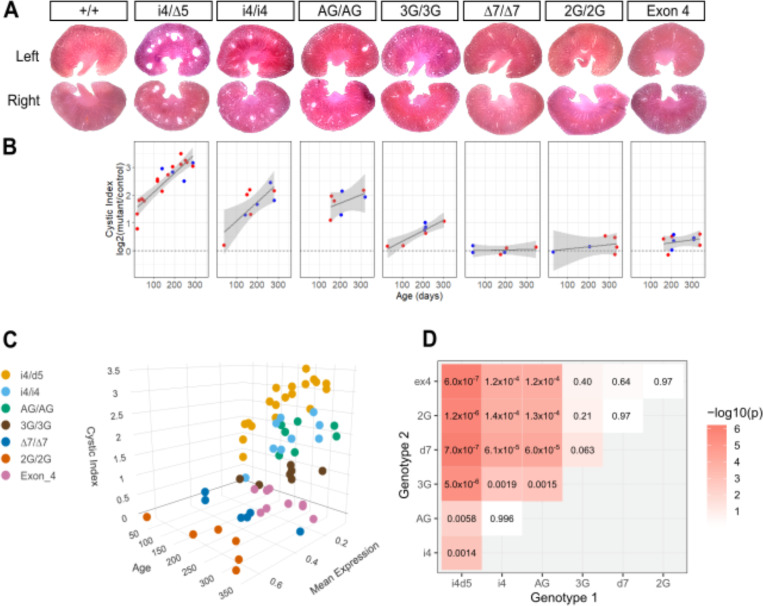
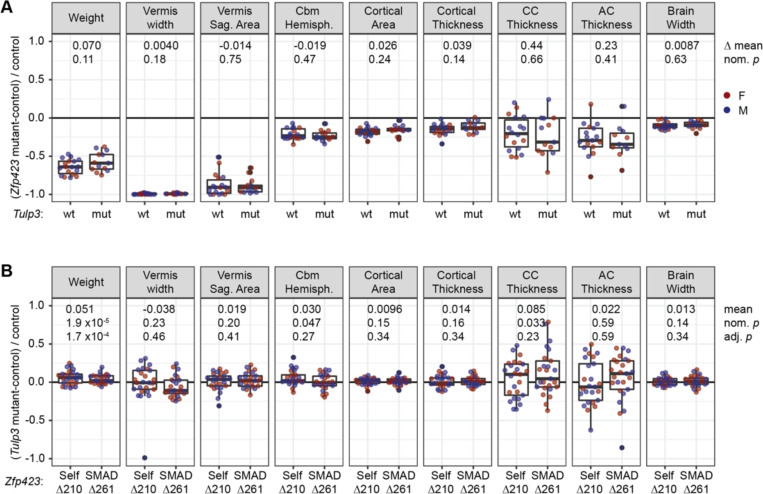
Tubby-like protein 3 (TULP3) regulates receptor trafficking in primary cilia and antagonizes SHH signaling. Tulp3 knockout mice are embryonic lethal with developmental abnormalities in multiple organs, while tissue-specific knockouts and viable missense alleles cause polycystic kidney disease. Human patients with TULP3 mutations present with variable, but often multi-organ fibrotic disease. We previously showed that mouse and human Tulp3 expression is negatively regulated by ZNF423, which is required for SHH sensitivity in some progenitor cell models. The level of TULP3 function required to prevent mutant phenotypes has not been known. Here we report a Tulp3 quantitative allelic series, designed by targeting the polypyrimidine tract 5' to the splice acceptor of a critical exon, that shows distinct dose-response effects on viability, brain overgrowth, weight gain, and cystic kidney disease. We find limited evidence for genetic interaction with Zfp423 null or hypomorphic mutations. Together, these results establish an approach to developing quantitative allelic series by exon exclusion, rank-order dose-sensitivity of Tulp3 phenotypes, and model thresholds for TULP3 function to prevent severe outcomes.


Conflict of interest statement

COMPETING INTERESTS The authors have declared that no competing interests exist.

Figures

Figure 1.
Figure 1.. Allelic series targeting polypyrimidine tracts.
(A) Genomic organization of Tulp3 showing targeted exons relative to encoded domains. (B) Deletion alleles relative to exon 4. (C) Exon 7 alleles relative to FVB/NJ reference sequence. BP, splicing branch points; SA, splice acceptor; poly(Y), polypyrimidine tract. (D) RT-PCR shows allele-dependent levels of exon skipping induced by mutations in the polypyrimidine tract 5’ to exon 7. (E) Sanger sequence of a control (top) and i4 homozygote (bottom) shows a majority of steady-state RNA spliced into the mutant-specific decoy splice acceptor. (F) Two-color Western blot detects TULP3 (red, upper) and loading control (green, lower) from E14.5 heads relative to size marker (kD). (G) Null (Δ5/Δ5) protein extracts with wild-type spike-in estimates detection limit at ~4% of control. (H) Band intensities relative to littermate controls define a quantitative allelic series based on reduced TULP3 protein expression. Dashed line, 4%. (I) Band intensities relative to littermate controls for show do not find nominally significant differences across four tissues at P29 (p-values 0.11 to 0.56 for each genotype, one-factor ANOVA).
Figure 2.
Figure 2.. Minimal TULP3 expression is sufficient for viability and survival to adulthood.
(A) Exencephaly and polydactyly are evident by E14.5 in Δ5 homozygotes. Bar, 1 mm. (B) Genotype ratios show complete lethality of null animals, but no significant evidence for reduced viability among even the strongest hypomorphic genotypes with TULP3 expression near the limit of detection in Western blots. Nominal p-values from the 1-df chi-squared test were adjusted for family-wise error rate (FWER-adj p) using Hommel’s method [25].
Figure 3.
Figure 3.. Allele-dependent weight gain in Tulp3 hypomorphs.
(A) Incidental observation of co-housed sex-matched littermates showed obesity in aged Tulp3 mutants. Each point is the difference (mutant-wildtype) in grams for a littermate pair. Mean age 220 days. (B) Time course of weight difference in individual i4/Δ5 littermate pairs and loess regression plots of i4/Δ5 pairs for each sex. (C) Loess plots for each allele, both sexes. (D) Summary boxplots with points for distinct individual pairs (first measure after postnatal day 100) for each Tulp3 allele. Mean difference in grams, sample size, and FWER-corrected p-values from paired sample t-tests are given for each allele (above) and expression class (below).
Figure 4.
Figure 4.. The strongest viable Tulp3 variants influence brain morphology.
(A) Compound heterozygotes i4/Δ5 average ~5–6% larger cerebellar vermis sagittal areas and anterior-posterior dimension of the cerebellar hemispheres. The widest extent of the brain was also nominally larger, but did not survive correction for multiple phenotypes (top row). Other strong hypomorphic genotypes (i4/i4, 3G/3G, AG/AG; combined to improve power across a similar expression level) showed nominal support for a lesser increase in vermis area and brain width that did not survive correction (second row). Neither the weaker exon 7 alleles (2G and Δ7) nor the exon 4 deletions (Δ67, Δ385) returned even nominally significant results for any measure. Mean, nominal p-value (paired sample t or Wilcoxon signed rank test), and adjusted p-value after FWER correction across 8 phenotype measures are shown. Abbreviations: Cbm Hemis, anterior-posterior dimension of the cerebellar hemispheres; Ctx Area, cortical area in dorsal surface view; Ctx Thick, average cortical thickness at 15°, 30°, and 45° from midline in coronal block face view; CC and AC Thick, thickness of the corpus callosum and anterior commissure, respectively, at the midline.
Figure 5.
Figure 5.. Allelic series shows dose-response in kidney cystogenesis.
(A) Kidney sections from aged adult mice show allele-typical degrees of cystogenesis. (B) Cystic index for Tulp3 variants showed allele- and age-dependence relative to same-sex control littermates. A generalized linear fit and 95% confidence interval are shown. (C) Three-dimensional visualization illustrates a sharp shift in cystic index across TULP3 expression levels. (D) Heatmap with printed values for TukeyHSD post-hoc test for difference between genotypes after two-factor ANOVA for cystic index as a function of genotype and age.
Figure 6.
Figure 6.. Hypomorphic Tulp3 mutations affect frequency and length distribution of primary cilia.
(A) Representative images of ARL13B immunofluorescence in primary cilia (red) with DAPI-stained nuclei (blue) from kidney sections of wild-type (+/+), i4/Δ5, and Δ67 mutant mice at postnatal day 20. Scale bar, 10 μm. (B) Mean cilium lengths for four littermate pairs, expressed as the log₂ ratio(mutant/wild-type). Female pairs red, males blue. (C) Ciliation frequency quantified as the percentage of ARL13B-positive cilia from 500–600 nuclei per sample. Lines connect control (left) and Tulp3-mutant (right) littermate samples. (D) Representative images showing localization of ARL13B (red) and TULP3 (green) relative to DAPI-stained nuclei (blue). Scale bar, 10 μm. (E) Magnified view of a single cilium showing single channel ARL13B (red), TULP3 (green), and merged channels to show localization of TULP3 to ciliary tip (top) or not (bottom). (F) Low but similar frequencies of TULP3 co-localization in ARL13B-defined cilia across genotypes. Lines connect littermate pairs. (G) Representative images showing ARL13B (red), GPR161 (green), and DAPI-stained nuclei (blue). Scale bar, 10 μm. (H) Magnified view of a single cilium showing single channel ARL13B (red), GPR161 (green), and merged channels to illustrate ciliary localization (top) or absence (bottom) of GPR161. (I) Quantification of GPR161 localization to cilia, expressed as the percentage of GPR161-positive cilia with ARL13B signal. Lines connect littermate pairs.
Figure 7.
Figure 7.. Genetic reduction of Tulp3 does not suppress Zfp423 null or hypomorphic phenotypes.
(A) Major Zfp423-null phenotypes are not substantially improved by reduced Tulp3 expression. Each point represents a Zfp423 mutant-wildtype same-sex littermate pair, from crosses with Zfp423N507Tfs*43 heterozygous and either Tulp3 wild-type (wt, n=18), or Tulp3 i4/Δ5 (mut, n=13) parents. Differences in the means between Zfp423 and double mutants along with nominal p-values from Welch Two Sample t-test are given. (B) Tulp3 reduction had only nominal effects on Zfp423 hypomorph measures other than weight. Homozygotes for viable in-frame deletions of a self-association domain (Δ210) or SMAD-binding zinc fingers (Δ261) with viable reductions in Tulp3 (i4/Δ5 or i4/i4) were compared to same-sex littermates homozygous for the same Zfp423 mutation but wild-type for Tulp3. Self-association domain n=26 pairs, SMAD-binding domain n=25 pairs. Paired sample t-tests or Wilcoxon signed rank test (vermis width) before and after adjustment for family-wise error rate (Hommel’s method) are shown for the combined sample (n=51). Effects on weight were independently significant in each group.
Figure 8.
Figure 8.. Summary of TULP3 expression-dependent effects.
Heat map shows mean protein level in E14.5 embryo heads (top row, blue) inversely proportional to measured phenotypes (rows 2–6, red). Very low levels of TULP3 expression are sufficient to avoid lethality and polydactyly. Only the lowest viable expression level has residual brain morphological abnormalities relative to same-sex control littermates. Genotypes with less than ~36% TULP3 expression show increased weight gain, with average values relative to same-sex littermates at ~100 days shown. Cystic index in kidneys showed continuous graded response to TULP3; interpolated average at 200 days is shown; severity of the null inferred from embryonic and juvenile kidneys of earlier Tulp3 models [16, 17]. nd, not determined; ns, no significant difference.

References

    1. Santagata S., et al. , G-protein signaling through tubby proteins. Science, 2001. 292(5524): p. 2041–50. - PubMed
    1. Norman R.X., et al. , Tubby-like protein 3 (TULP3) regulates patterning in the mouse embryo through inhibition of Hedgehog signaling. Hum Mol Genet, 2009. 18(10): p. 1740–54. - PMC - PubMed
    1. Nishina P.M., et al. , Molecular characterization of a novel tubby gene family member, TULP3, in mouse and humans. Genomics, 1998. 54(2): p. 215–20. - PubMed
    1. Mukhopadhyay S., et al. , TULP3 bridges the IFT-A complex and membrane phosphoinositides to promote trafficking of G protein-coupled receptors into primary cilia. Genes Dev, 2010. 24(19): p. 2180–93. - PMC - PubMed
    1. Mukhopadhyay S., et al. , The ciliary G-protein-coupled receptor Gpr161 negatively regulates the Sonic hedgehog pathway via cAMP signaling. Cell, 2013. 152(1–2): p. 210–23. - PubMed

Publication types

LinkOut - more resources