[Preprint]. 2025 Sep 21:2025.09.19.25336146.
doi: 10.1101/2025.09.19.25336146.

Complex Genetics and Regulatory Drivers of Hypermobile Ehlers-Danlos Syndrome: Insights from Genome-Wide Association Study Meta-analysis

Affiliations

Complex Genetics and Regulatory Drivers of Hypermobile Ehlers-Danlos Syndrome: Insights from Genome-Wide Association Study Meta-analysis

Taylor Petrucci-Nelson et al. medRxiv. .

Abstract

Background: Hypermobile Ehlers-Danlos syndrome (hEDS) is the most common subtype of EDS, a group of heritable connective tissue disorders. Clinically, hEDS is defined by generalized joint hypermobility and chronic musculoskeletal pain, but its impact extends beyond the musculoskeletal system. Affected individuals frequently experience autonomic, gastrointestinal, immune, and neuropsychiatric involvement, highlighting both the multisystemic nature of the condition and challenges of diagnosis. In contrast to other EDS subtypes with defined genetic causes, the molecular basis of hEDS has remained elusive.

Methods: We conducted a genome-wide association study (GWAS) of hEDS across three case controls studies, including 1,815 cases and 5,008 ancestry-matched controls. Fixed-effects meta-analysis of 6.2 million variants was complemented with LDAK gene-based association testing, transcriptome-wide association studies, and integrative annotation across multiple tissues and cell types including eQTLs, enhancer marks and open chromatin accessibility profiles, supported by luciferase assays on one candidate variant. LD-score genetic correlations were assessed between hEDS and 19 frequently reported comorbid conditions.

Results: Two loci reached genome-wide significance, including a regulatory region near the atypical chemokine receptor 3 gene (ACKR3) on chromosome 2. Functional annotation supports ACKR3 risk alleles colocalize with eQTLs in tibial nerve, alter enhancer activity, and generate a de novo AHR transcription factor regulatory site, implicating neuroimmune and pain signaling pathways. Gene-based and transcriptome-wide analyses identified common variants in a locus containing multiple candidates, including SLC39A13, a zinc transporter critical for connective tissue development previously implicated in a rare form of EDS, and PSMC3, a gene involved in central nervous system development. LD-score regression revealed significant genetic correlations between hEDS and joint hypermobility, myalgic encephalomyelitis/chronic fatigue syndrome, fibromyalgia, depression, anxiety, autism spectrum disorder, migraine, and gastrointestinal diseases.

Conclusions: These results establish the first evidence of common variant contributions to hEDS, supporting a complex, multisystem model involving neuroimmune-stromal dysregulation. Our findings add novel indications to hEDS pathogenesis and provide solid foundations for future molecular definition and therapeutic discovery.

Keywords: Genome-wide association study; Hypermobile Ehlers-Danlos Syndrome; neurodevelopment; neuroimmune signaling.


Figures
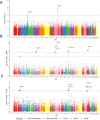
Figure 1.
Figure 1.. SNP and gene-based case control GWAS for hypermobile Elhers Danlos syndrome.
A: Manhattan plot representation of meta-analysis of three case control GWAS including 1700 cases of hypermobile Elhers Danlos syndrome (hEDS) and 5000 controls. -log10 of association P-value (from a two-sided Wald test) is represented on the y-axis, genomic coordinates on the x-axis. SNPs located +/− 500kb of genome-wide significant signals are highlighted. Closest gene of independent lead SNPs with P-value ≤ 5×10⁻⁸ is indicated for each locus. Dashed red line: P-value = 5×10⁻⁸. Dashed grey line: P-value = 1×10⁻⁵. B: Manhattan plot representation of gene-based case control GWAS using LDAK GBAT package. −log10 of association P-value (from a two-sided Wald test) is represented on the y-axis for each gene, genomic coordinates on the x-axis. Enlarged dot size indicates genes with FDR < 0.05. Names of Bonferroni significant genes are indicated. Dashed red line corresponds to Bonferroni significant threshold: P-value = 2.8×10⁻⁶. Dashed grey line: FDR < 0.05. C: Manhattan plot representation of hEDS transcriptome-wide association study (TWAS). −log10 of association P-value is represented on the y-axis for each gene, genomic coordinates on the x-axis. Enlarged dot size indicates genes with FDR < 0.05, which are indicated. Black lining indicates associations for which genetic colocalization was found (PP.H4.abf > 0.8). Only top tissue is shown for each gene. Dot shape represent tissue type. Dashed grey line: FDR < 0.05
Figure 2.
Figure 2.. Gene prioritization and functional annotation at ACKR3 locus
A. LocusZoom plot representing hEDS association at ACKR3 locus (chromosome 2). Dot shape indicate the lead SNP (diamond shape), and effect size (β) of nominally significant variants (upper triangle: β>0, lower triangle, β<−0, round shape: p-value>0.05). Dot-color indicates linkage desequilibrium (r2) with the lead SNP at each locus in the European subset of 1000G reference panel. B. x-y plot representing −log10(P-value) of ACKR3 eQTL association in Tibial Nerve (y-axis) vs hEDS association (x-axis) for all SNPs within 500kb of lead SNP at ACKR3 locus. Diamond dot shape indicates the SNP maximizing association to both ACKR3 eQTL and hEDS. Dot-color indicates linkage desequilibrium (r2) with this SNP in the European subset of 1000G reference panel. Posterior probability for colocalization of both signals is indicated over the graph. C. Genome browser visualization of H3K27ac ChIP/ATAC-Seq/snATAC-Seq read densities in the region surrounding putative hEDS causal variants at ACKR3 locus. Position of rs2600746 is indicated by dashed line. D. Violin plot representing the normalized expression of ACKR3 in Tibial Nerve depending on rs2600746 genotype. Number of individuals for each genotype are indicated in legend. P-value of eQTL association is 9.5×10⁻⁶. E. Alignment of AHR, ZNF335, CXXC4 and HIF1A transcription factors motifs to rs2600746 C (risk) or G (protective) allele. Motif logos were retrieved from Hocomoco database (v13). F. A 3 times repeat of the genomic region containing either the protective or risk allele of rs2600746 was cloned upstream of a minimal CMV promoter and transfected into NIH3T3 cells. Firefly luciferase activity was normalized to Renilla luciferase and expressed as fold change relative to the protective allele construct. Data represent mean ± SD from n = 4 independent biological replicates with 3 technical replicates each. Statistical significance was determined by one-way ANOVA with multiple pairwise comparisons (α=0.05).
Figure 3.
Figure 3.. Gene prioritization and functional annotation at SLC39A13 locus
A. Representation of hEDS gene-based association at SLC39A13 locus (chromosome 11). −log10 of association P-value (from a two-sided Wald test) is represented on the y-axis. Arrows represent gene position and orientation along the genome (x-axis). Arrow color indicates Z-score of gene-based association. Dashed red line corresponds to Bonferroni significant threshold: P-value = 2.8×10⁻⁶. Dashed grey line: FDR < 0.05. B. Illustration of the position of candidate causal variants with respect to SLC39A13 transcription unit. Position of missense variant rs61897432 (p.Thr.20Ala.) is indicated. C. Representation of predicted protein structure for SLC39A13 and position of residue affected by missense variant. Structure prediction was retrieved and visualized from AlphaFold protein structure database (alphafold.ebi.ac.uk/). Backbone color indicates the confidence of structure prediction.
Figure 4:
Figure 4:. Genetic correlations between hEDS and frequently reported comorbidities in patients.
Forest plot points show rg estimates with horizontal bars as their 95% confidence intervals. Traits are grouped by disease category and ordered by P-value within each category. The dashed line marks rg=0. Nominal P-values are displayed; associations meeting Bonferroni-corrected significance are marked with an asterisk and were defined as P<0.0031 considering 16 non-redundant phenotypes.

References

    1. Gensemer C. et al. Hypermobile Ehlers-Danlos syndromes: Complex phenotypes, challenging diagnoses, and poorly understood causes. Dev Dyn 250, 318–344 (2021). - PMC - PubMed
    1. Demmler J.C. et al. Diagnosed prevalence of Ehlers-Danlos syndrome and hypermobility spectrum disorder in Wales, UK: a national electronic cohort study and case-control comparison. BMJ Open 9, e031365 (2019).
    1. Halverson C.M.E., Cao S., Perkins S.M. & Francomano C.A. Comorbidity, misdiagnoses, and the diagnostic odyssey in patients with hypermobile Ehlers-Danlos syndrome. Genet Med Open 1, 100812 (2023). - PMC - PubMed
    1. Daylor V. et al. Defining the Chronic Complexities of hEDS and HSD: A Global Survey of Diagnostic Challenges, Life-Long Comorbidities, and Unmet Needs. J Clin Med 14(2025).
    1. Severance S. et al. Hypermobile Ehlers-Danlos syndrome and spontaneous CSF leaks: the connective tissue conundrum. Front Neurol 15, 1452409 (2024). - PMC - PubMed

Publication types