. 2025 Sep 11;14(18):1423.
doi: 10.3390/cells14181423.

Interaction Between Human Skeletal and Mesenchymal Stem Cells Under Physioxia Enhances Cartilage Organoid Formation: A Phenotypic, Molecular, and Functional Characterization

Affiliations

Interaction Between Human Skeletal and Mesenchymal Stem Cells Under Physioxia Enhances Cartilage Organoid Formation: A Phenotypic, Molecular, and Functional Characterization

Cristian Mera Azain et al. Cells. .

Abstract

Articular cartilage regeneration remains a major challenge due to its limited self-repair capacity. Bone marrow-derived skeletal stem cells (SSCs) and mesenchymal stem cells (MSCs) are promising candidates for cartilage engineering, although they differ in their chondrogenic potential. This study explored whether co-culturing SSCs and MSCs in three-dimensional (3D) organoid systems under cartilage physioxia (5% O2) and chondrogenic induction could improve cartilage tissue formation. SSCs, MSCs, and SSC-MSC co-cultures were characterized for morphology, phenotype, and differentiation capacity. Organoids were generated and cultured for 10 days, followed by analysis of morphology, viability, gene expression (SOX9, RUNX2, ACAN, COL2A1, COL10A1, PRG4, and PDPN), chondrocyte-associated antigens (CD44, CD105, CD146, and PDPN), and cartilage ECM proteins (aggrecan, collagen types I, II, and X, and PRG4). SSCs showed robust chondrogenic and osteogenic potential, while MSCs exhibited a balanced multipotency. Co-culture-derived organoids enhanced chondrogenesis and reduced adipogenesis, with higher expression of cartilage-specific ECM and lower hypertrophic marker levels. These findings highlight the functional synergy between SSCs and MSCs in co-culture, promoting the formation of stable, cartilage-like structures under physioxia. The approach offers a promising strategy for generating preclinical models and advancing regenerative therapies for hyaline cartilage repair.

Keywords: cartilage organoids; chondrogenesis; mesenchymal stem cells; physioxia; skeletal stem cells.


Conflict of interest statement

The authors declare that this research was conducted in the absence of any commercial or financial relationships that could be construed as potential conflicts of interest.

Figures
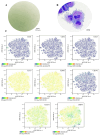
Figure 1
Figure 1
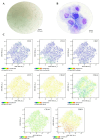
Phenotypic characterization of the SSC pool: (A) Cell morphology in culture, Olympus inverted microscope (10×). (B) Cell morphology in cytospin, ZEISS (Oberkochen, Germany) Axiolab 5 microscope (100×). (C) Immunophenotype analysis by spectral flow cytometry is displayed as a heatmap using t-SNE dimensionality reduction. The antigen assessed is indicated in the top right corner of each panel, and the color scale in the bottom left corner denotes antigen expression levels: negative (blue), weakly positive (green), moderately positive (yellow), and strongly positive (red).
Figure 2
Figure 2
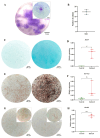
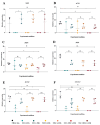
Functional characterization of the SSC pool: (A) Colony-forming unit (CFU) assay. Representative images of SSC-derived colonies after 14 days of culture, stained with 3% crystal violet. Images were acquired using an Olympus inverted microscope at 10× magnification (inset, 40×). (B) Absolute quantification of SSC-derived colonies after 14 days of culture. (C) Chondrogenic differentiation. SSCs cultured without (left) or with (right) chondrogenic differentiation medium. Alcian Blue staining at 10× magnification. (D) SOX9 gene expression in undifferentiated (control) and differentiated (induced) SSCs (p = 0.0082). (E) Osteogenic differentiation. SSCs cultured without (left) or with (right) osteogenic differentiation medium. Von Kossa staining at 10× magnification. (F) RUNX2 gene expression in undifferentiated (control) and differentiated (induced) SSCs (p = 0.1287). (G) Adipogenic differentiation. SSCs cultured without (left) or with (right) adipogenic differentiation medium. Oil Red O staining at 10× magnification (inset, 40×). (H) PPARγ gene expression in undifferentiated (control) and differentiated (induced) SSCs (p = 0.0082). Statistical significance was assessed using a two-tailed Student’s t-test. ** p < 0.01; **** p < 0.0001. ns: non-significant.
Figure 3
Figure 3
Phenotypic characterization of MSCs: (A) Cell morphology in culture, Olympus inverted microscope (10×). (B) Cell morphology in cytospin, ZEISS Axiolab 5 microscope (100×). (C) Immunophenotype analysis by spectral flow cytometry is displayed as a heatmap using t-SNE dimensionality reduction. The antigen assessed is indicated in the top right corner of each panel, and the color scale in the bottom left corner denotes antigen expression levels: negative (blue), weakly positive (green), moderately positive (yellow), and strongly positive (red).
Figure 4
Figure 4
Functional characterization of the MSC pool: (A) Colony-forming unit (CFU) assay. Representative images of MSC-derived colonies after 14 days of culture, stained with 3% crystal violet. Images were acquired using an Olympus inverted microscope at 10× magnification (inset, 40×). (B) Absolute quantification of MSC-derived colonies after 14 days of culture. (C) Chondrogenic differentiation. MSCs cultured without (left) or with (right) chondrogenic differentiation medium. Alcian Blue staining at 10× magnification. (D) SOX9 gene expression in undifferentiated (control) and differentiated (induced) MSCs (p = 0.0001). (E) Osteogenic differentiation. MSCs cultured without (left) or with (right) osteogenic differentiation medium. Von Kossa staining at 10× magnification. (F) RUNX2 gene expression in undifferentiated (control) and differentiated (induced) MSCs (p = 0.3744). (G) Adipogenic differentiation. MSCs cultured without (left) or with (right) adipogenic differentiation medium. Oil Red O staining at 10× magnification (inset, 40×). (H) PPARγ gene expression in undifferentiated (control) and differentiated (induced) MSCs (p = 0.0010). Statistical significance was assessed using a two-tailed Student’s t-test. ** p < 0.01; *** p < 0.001. ns: non-significant.
Figure 5
Figure 5
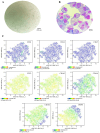
Phenotypic characterization of SSCs in co-culture with MSCs: (A) Cell morphology in culture, Olympus inverted microscope (10×). (B) Cell morphology in cytospin, ZEISS Axiolab 5 microscope (100×). (C) Immunophenotype analysis by spectral flow cytometry is displayed as a heatmap using t-SNE dimensionality reduction. The antigen assessed is indicated in the top right corner of each panel, and the color scale in the bottom left corner denotes antigen expression levels: negative (blue), weakly positive (green), moderately positive (yellow), and strongly positive (red).
Figure 6
Figure 6
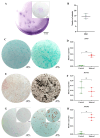
Functional characterization of the SSC pool in co-culture with MSCs: (A) Colony-forming unit (CFU) assay. Representative images of SSC-MSC co-culture-derived colonies after 14 days of culture, stained with 3% crystal violet. Images were acquired using an Olympus inverted microscope at 10× magnification (inset, 40×). (B) Absolute quantification of SSC-MSC co-culture-derived colonies after 14 days of culture. (C) Chondrogenic differentiation. SSC-MSC co-culture without (left) or with (right) chondrogenic differentiation medium. Alcian Blue staining at 10× magnification. (D) SOX9 gene expression in undifferentiated (control) and differentiated (induced) MSCs (p = 0.0001). (E) Osteogenic differentiation. MSCs cultured without (left) or with (right) osteogenic differentiation medium. Von Kossa staining at 10× magnification. (F) RUNX2 gene expression in undifferentiated (control) and differentiated (induced) MSCs (p = 0.5282). (G) Adipogenic differentiation. MSCs cultured without (left) or with (right) adipogenic differentiation medium. Oil Red O staining at 10× magnification (inset, 40×). (H) PPARγ gene expression in undifferentiated (control) and differentiated (induced) MSCs (p = 0.0001). Statistical significance was assessed using a two-tailed Student’s t-test. **** p < 0.0001. ns: non-significant.
Figure 7
Figure 7
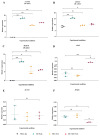
Comparative gene expression profiles associated with pluripotency and multipotency in SSC, MSC, and SSC–MSC co-culture pools: (AC) Relative expression levels of pluripotency-associated genes (NANOG, OCT3/4, and TRA1-81) in SSC, MSC, and SSC–MSC co-culture pools cultured in basal medium (i.e., without differentiation stimuli). (DF) Expression of lineage-specific transcription factors related to multipotency—SOX9 (chondrogenesis), RUNX2 (osteogenesis), and PPARγ (adipogenesis)—in cell pools subjected to lineage-specific differentiation media. The statistical difference is generated by Group A. Statistical significance was assessed using one-way ANOVA followed by post hoc multiple comparisons; ** p < 0.01; *** p < 0.001; **** p < 0.0001, ns: non-significant.
Figure 8
Figure 8
Comparative phenotypic characterization of control cell populations: (A,B) NHAC-kn: Cell morphology in culture (Olympus inverted microscope, 10×) and in cytospin preparations (ZEISS Axiolab 5 microscope, 100×). (C,D) HPdLF: Cell morphology in culture (Olympus inverted microscope, 10×) and in cytospin preparations (ZEISS Axiolab 5 microscope, 100×). (E) t-SNE analysis was performed to visualize the spatial segregation of the two control cell populations, providing a reference framework for the interpretation of subsequent immunophenotyping plots. Immunophenotypic profiling by spectral flow cytometry, displayed as heatmaps generated using t-SNE dimensionality reduction. The antigen analyzed is indicated in the top right corner of each panel. The color scale in the bottom left indicates expression levels: negative (blue), weakly positive (green), moderately positive (yellow), and strongly positive (red).
Figure 9
Figure 9
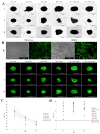
Diameter and viability assessment of cartilage organoids derived from co-cultured SSC, MSC, and SSC–MSC groups: (A) Representative images of cartilage organoids at days 1, 5, and 10 of culture, derived from SSC, MSC, and SSC–MSC groups, cultured with or without chondrogenic differentiation medium. Images were acquired using a Cytation 5 imaging system (BioTek) under 10× magnification. (B) Viability assessment of spheroids derived from control cell populations (NHAC-kn and HPdLF) and from SSC, MSC, and SSC–MSC groups, cultured with or without chondrogenic differentiation medium at days 1, 5, and 10. Cell viability was evaluated using the LIVE/DEAD™ Cell Imaging Kit (Invitrogen, Thermo Fisher Scientific®). Live cells fluoresce green (calcein AM), and dead cells fluoresce red (ethidium homodimer-1). Images were acquired with the Cytation 5 system at 10× magnification. (C) Quantification of spheroid diameters at days 1, 5, and 10 of culture. (D) Percentage viability of control cell populations and cartilage organoids at days 1, 5, and 10. The dashed line represents the 90% viability threshold, indicating that all populations maintained >90% viability under the experimental conditions throughout the culture period. Data on diameters and viability under the experimental conditions were acquired and analyzed using the Cytation 5 imaging system (BioTek).
Figure 10
Figure 10
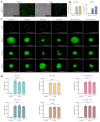
Assessment of oxygen levels in cartilage organoids and control cell populations: (A) Representative images of control cell lines (NHAC-kn and HPdLF) after 10 days of culture under 5% O2. Bright-field and fluorescence images were acquired following staining with the hypoxia-sensitive probe BioTracker™ 520 Green Hypoxia Dye (Sigma-Aldrich®). Under normoxic conditions (21% O2), the dye remains inactive or exhibits low fluorescence. Under hypoxic conditions (5% O2), it is chemically reduced by intracellular enzymes, such as oxidoreductases, resulting in green fluorescence activation. (B) Quantification of fluorescence intensity in control cell populations cultured under 21% and 5% O2. Increased fluorescence intensity indicates lower oxygen availability. (C) Fluorescence and bright-field images of cartilage organoids derived from SSC, MSC, and SSC–MSC co-culture pools, cultured with or without chondrogenic differentiation medium. Organoids were cultured at 21% O2 (no fluorescence) or 5% O2 for 1, 5, and 10 days, showing increasing green fluorescence under hypoxic conditions. (D) Quantification of fluorescence intensity in cartilage organoids cultured under 21% and 5% O2. Significantly higher fluorescence was observed at 5% O2. Statistical significance was determined by one-way ANOVA with post hoc multiple comparisons; *** p < 0.001; **** p < 0.0001.
Figure 11
Figure 11
Expression of genes associated with chondrogenesis in cartilage organoids derived from SSC, MSC, and SSC–MSC co-culture pools after 10 days of culture: (AD) Relative expression of SOX9, ACAN, PDPN, and PRG4 in chondrocytes from the NHAC-kn cell line and in cartilage organoids cultured with or without chondrogenic differentiation medium. (E,F) Relative expression of RUNX2 and COL10A1 in chondrocytes from the NHAC-kn cell line and in cartilage organoids under the same conditions. Statistical significance was assessed using a two-tailed Student’s t-test; * p < 0.05; *** p < 0.001; **** p < 0.0001. ns: non-significant.
Figure 12
Figure 12
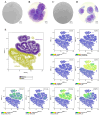
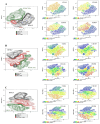
Generation of chondrocytes from cartilage organoids derived from SSCs, MSCs, and SSC–MSC co-cultures: After 10 days of culture in chondrogenic differentiation medium, cartilage organoids were enzymatically disaggregated, and the generation of chondrocytes exhibiting a CD44+/CD105+/CD146+/PDPN+ phenotype was assessed by spectral flow cytometry. The immunophenotypic profiles of organoid-derived cells were compared with those of control cell lines (NHAC-kn and HPdLF). (A) The t-SNE analysis illustrating the spatial distribution of the two control populations and SSC-derived organoid cells. Heatmaps and t-SNE plots show the expression levels of CD44, CD105, CD146, and PDPN. (B) The t-SNE analysis illustrating the spatial distribution of the control populations and MSC-derived organoid cells. Heatmaps and t-SNE plots show the expression of the same antigenic markers. (C) The t-SNE analysis illustrating the spatial distribution of the control populations and cells derived from SSC–MSC co-culture organoids. Heatmaps and t-SNE plots indicate expression of CD44, CD105, CD146, and PDPN. Statistical significance was assessed using one-way ANOVA followed by multiple comparisons. The antigen analyzed is indicated in the top right corner of each panel. The color scale in the bottom left indicates expression levels: negative (blue), weakly positive (green), moderately positive (yellow), and strongly positive (red).
Figure 13
Figure 13
Extracellular matrix (ECM) protein production in cartilage organoids: (A) Immunohistochemical detection of aggrecan, type II collagen, proteoglycan-4, type I collagen, and type X collagen in SSC-derived organoids cultured without (–IM) or with (+IM) chondrogenic induction medium. Images acquired with an Olympus microscope at 10× magnification. (B) Immunohistochemical detection of the same ECM proteins in MSC-derived organoids under the same conditions. (C) Immunohistochemical detection of ECM proteins in organoids derived from SSC–MSC co-cultures, with or without chondrogenic induction medium. Images acquired with an Olympus microscope at 10× magnification. (DF) Semi-quantitative scoring of ECM protein expression (aggrecan, type II collagen, proteoglycan-4, type I collagen, and type X collagen) in SSC-derived organoids (D), MSC-derived organoids (E), and SSC–MSC co-culture organoids (F), cultured with or without chondrogenic induction medium. (G) Comparative scoring of aggrecan, type II collagen, and proteoglycan-4 expression between cartilage organoids and the NHAC-kn chondrocyte line. (H) Comparative scoring of type I and type X collagen expression between cartilage organoids and the NHAC-kn chondrocyte line. The statistical difference is generated by Group A (G,H). Statistical significance was determined using the Kruskal–Wallis test followed by multiple comparisons; * p < 0.05; *** p < 0.001; **** p < 0.0001. ns: non-significant.

References

    1. Ishida O., Tanaka Y., Morimoto I., Takigawa M., Eto S. Chondrocytes Are Regulated by Cellular Adhesion Through CD44 and Hyaluronic Acid Pathway. J. Bone Miner. Res. 2009;12:1657–1663. doi: 10.1359/jbmr.1997.12.10.1657. - DOI - PubMed
    1. Belluzzi E., Todros S., Pozzuoli A., Ruggieri P., Carniel E.L., Berardo A. Human Cartilage Biomechanics: Experimental and Theoretical Approaches towards the Identification of Mechanical Properties in Healthy and Osteoarthritic Conditions. Processes. 2023;11:1014. doi: 10.3390/pr11041014. - DOI
    1. Berni M., Marchiori G., Baleani M., Giavaresi G., Lopomo N.F. Biomechanics of the Human Osteochondral Unit: A Systematic Review. Materials. 2024;17:1698. doi: 10.3390/ma17071698. - DOI - PMC - PubMed
    1. Householder N.A., Raghuram A., Agyare K., Thipaphay S., Zumwalt M. A Review of Recent Innovations in Cartilage Regeneration Strategies for the Treatment of Primary Osteoarthritis of the Knee: Intra-Articular Injections. Orthop. J. Sports Med. 2023;11:23259671231155950. doi: 10.1177/23259671231155950. - DOI - PMC - PubMed
    1. Arruda A.L., Katsoula G., Chen S., Reimann E., Kreitmaier P., Zeggini E. The Genetics and Functional Genomics of Osteoarthritis. Annu. Rev. Genom. Hum. Genet. 2024;25:239–257. doi: 10.1146/annurev-genom-010423-095636. - DOI - PubMed

LinkOut - more resources