. 2025 Sep 26;11(39):eadx5495.
doi: 10.1126/sciadv.adx5495. Epub 2025 Sep 26.

STK11 coordinates IL-4 signaling with metabolic reprogramming to control M2 macrophage polarization and antitumor immunity

Affiliations

STK11 coordinates IL-4 signaling with metabolic reprogramming to control M2 macrophage polarization and antitumor immunity

Jing Yang et al. Sci Adv. .

Abstract

Macrophages integrate microenvironmental cues to orchestrate complex transcriptional and metabolic programs that drive functional polarization. Here, we demonstrate that STK11 links interleukin-4 (IL-4) signaling with metabolic reprogramming to restrain alternatively activated (M2) macrophage polarization. Through integrative transcriptomic and metabolomic analyses, we identified STK11 as a key transcriptional and metabolic regulator during M2 polarization. STK11 deficiency enhanced the expression of M2-associated markers and promoted glutamine metabolism in IL-4-stimulated macrophages. Mechanistically, STK11 deficiency led to increased FOXO1 activation, thereby promoting M2 polarization. Pharmacological inhibition of FOXO1 or glutamine metabolism effectively reversed the enhanced M2 polarization. In an orthotopic model of pancreatic ductal adenocarcinoma, myeloid-specific deletion of STK11 resulted in increased accumulation of M2-like tumor-associated macrophages, impaired antitumor immunity, and accelerated tumor progression. These findings uncover a previously unrecognized role for STK11 in modulating M2 macrophage polarization, offering mechanistic insights that may inform the development of immunometabolic therapies for pancreatic cancer.


Figures
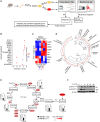
Fig. 1.
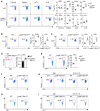
Fig. 1.. Identification of STK11 as a previously unknown regulator of M2-like macrophage polarization.
(A) Schematic diagram of the integrative approach used to identify regulators of M2-like macrophage polarization. (B) Ingenuity pathway analysis (IPA) of differentially expressed genes (DEGs) identified key upstream regulators of M2-like macrophage polarization. (C) Heatmap showing expression levels of downstream genes of STK11 in M2-like macrophages. (D) Circos plot showing enriched pathways from both transcriptomic and metabolomic data. Red dots represent genes, while blue dots indicate metabolites. The y axis depicts the log2 (fold change) in IL-4–stimulated bone marrow–derived macrophages (BMDMs) compared to vehicle-treated controls. (E) Alteration in expression levels of genes and metabolites in the tricarboxylic acid (TCA) cycle and glutaminolysis. Bar plots depict fold changes in metabolite levels. Up-regulated genes are represented with varying intensities of red. CoA, coenzyme A; succinate-CoA ligase GDP/ADP-forming subunit alpha (SUCLG1), succinate dehydrogenase complex subunits A (SDHA), SDHB, SDHD, citrate synthase (CS), aconitase 2 (ACO2), fumarate hydrase (FH), oxoglutarate dehydrogenase (OGDH), malate dehydrogenase 1 (MDH1), isocitrate dehydrogenase1 (IDH1), glutamate dehydrogenase 1 (GLUD1), GLUD2, glutaminase (GLS), and solute carrier family 1 member 5 (SLC1A5). (F) Western blot analysis of phosphorylation of STK11 at serine-428 (p-STK11S428), phosphorylation of signal transducer and activator of transcription 6 (STAT6) at tyrosine-641 (p-STAT6T641), and β-actin expression in BMDMs stimulated with vehicle or IL-4 for the indicated time points. Data are representative of one experiment [(B) to (E)] or at least three independent experiments (F) and are presented as the means ± SEM. P values were calculated using two-tailed Student’s t test (E). ***P < 0.001 and ****P < 0.0001. h, hours.
Fig. 2.
Fig. 2.. STK11 deficiency promotes M2-like macrophage polarization.
(A and B) Relative expression of Mrc1 and Arg1 mRNA (A), and Il10 and Tgfb mRNA (B) in WT and LysMCreStk11fl/fl BMDMs stimulated with IL-4 (20 ng/ml) for 24 hours. (C to E) Comparisons of CD206 (C), CD163 (D), and CD301 (E) expression on IL-4–stimulated WT and LysMCreStk11fl/fl BMDMs. Numbers in graphs indicate the mean fluorescence intensity (MFI). (F and G) Relative expression of Mrc1 and Arg1 mRNA (G), and Il10 and Tgfb mRNA (H) in WT and LysMCreStk11fl/fl PMs stimulated with IL-4 (20 ng/ml) for 24 hours. (H to J) Percentages of CD4+ T cells producing IFN-γ (H), or IL-17 (I), or IL-4 (J) in the spleen from WT and LysMCreStk11fl/fl mice (n = 5 per group). (K) Percentages of IFN-γ–producing CD8 T cells in the spleen from WT and LysMCreStk11fl/fl mice (n = 5 per group). (L) Representative images of hematoxylin and eosin staining of the lung, small intestine, and colon from WT and LysMCreStk11fl/fl mice (scale bar, 100 μm). Data are representative of at least three independent experiments [(A) to (L)] and are presented as the means ± SEM. P values were calculated using two-tailed Student’s t test [(A) to (K)]. *P < 0.05 and **P < 0.01; n.s., not significant.
Fig. 3.
Fig. 3.. LysMCreStk11fl/fl mice display increased proportions of Treg cells.
(A to C) Percentages and numbers of Treg cells (Foxp3+CD4+) in lymphoid tissues (A), lung (B) and liver (C) from WT and LysMCreStk11fl/fl mice (n = 5 per group). (D) Comparison of Ki67 expression in splenic Treg cells from WT and LysMCreStk11fl/fl mice (n = 5 per group). Numbers in graphs indicate the MFI of Ki67. (E) Percentages of CD103+ Treg cells in the spleen from WT and LysMCreStk11fl/fl mice (n = 5 per group). (F and G) Flow cytometry analysis of Foxp3+ (F) and CD103+Foxp3+ (G) populations in OT-II CD4+ T cells cocultured with WT or LysMCreStk11fl/fl BMDMs in the presence of OVA and TGF-β for 4 days. (H and I) Flow cytometry analysis of Foxp3+ (H) and CD103+Foxp3+ (I) populations in OT-II CD4+ T cells cocultured with WT or STK11-deficient BMDMs in the presence of OVA and TGF-β, along with IgG or IL-10 neutralizing antibodies for 4 days. Data are representative of at least three independent experiments [(A) to (I)] and are presented as the means ± SEM. P values were calculated using two-tailed Student’s t test [(A) to (E)]. *P < 0.05, **P < 0.01, ***P < 0.001, and ****P < 0.0001; n.s., not significant. Tregs, Treg cells.
Fig. 4.
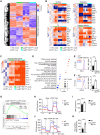
Fig. 4.. STK11 orchestrates transcriptional regulation of M2-like macrophage polarization.
(A) Heatmap with unsupervised hierarchical clustering of the DEGs in WT and LysMCreStk11fl/fl BMDMs stimulated with vehicle or IL-4 (n = 3 per group). (B) Heatmap showing the DEGs of the conditioned WT and STK11-deficient BMDMs. (C) Heatmap showing the expression of M2-associated markers in BMDMs. (D) IPA results indicating the top canonical pathways enriched in the DEGs of IL-4–stimulated STK11-deficient BMDMs. GM-CSF, granulocyte-macrophage colony-stimulating factor; GTPases, guanosine triphosphatases; MAPK, mitogen-activated protein kinase; NFAT, nuclear factor of activated T cells. (E and F) Comparisons of PD-L1 (E) and PD-L2 (F) expression on IL-4–stimulated WT and STK11-deficient BMDMs. (G) Gene set enrichment analysis results showing up-regulation of OXPHOS in STK11-deficient BMDMs. NES, normalized enrichment score. FDR, false discovery rate. (H) Measurement of OCR in IL-4–stimulated WT and LysMCreStk11fl/fl BMDMs. R/A, rotenone plus antimycin. (I) Spare respiratory capacity (SRC) in WT and LysMCreStk11fl/fl BMDMs. (J) Measurement of OCR in IL-4–stimulated BMDMs in response to the indicated mitochondrial inhibitors. (K) Eto-sensitive OCR in IL-4–stimulated BMDMs. Data are representative of one [(A) to (D) and (G)] or at least three [(E), (F), and (H) to (K)] independent experiments and are presented as the means ± SEM. P values were calculated using two-tailed Student’s t test [(E), (F), (I), and (K)] or two-way analysis of variance (ANOVA) with Bonferroni’s multiple comparison test [(H) and (J)]. *P < 0.05, **P < 0.01, ***P < 0.001, and ****P < 0.0001.
Fig. 5.
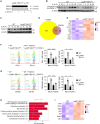
Fig. 5.. STK11 restrains FOXO1 activation upon IL-4 stimulation.
(A) IPA results showing enhanced activation of FOXO1 and FOXO3 in IL-4–stimulated STK11-deficient BMDMs. (B) Immunoblotting of p-FOXO1T24, p-FOXO3T32, and β-actin in BMDMs stimulated with vehicle or IL-4. (C) Immunoblotting of FOXO1 and β-actin expression in BMDMs stimulated with vehicle or IL-4. h, hours. (D) Venn diagram showing the DEGs uniquely regulated or coregulated by FOXO1 and/or FOXO3 in IL-4–stimulated BMDMs (n = 3). (E) Heatmap showing the expression of the DEGs uniquely regulated by FOXO1 in IL-4–stimulated BMDMs. (F and G) Comparison of PD-L1 and PD-L2 expression (F) or CD206 and CD163 expression (G) on IL-4–stimulated BMDMs in the presence of vehicle or FOXO1i. (H) Bar graph showing Kyoto Encyclopedia of Genes and Genomes (KEGG) and Reactome Pathway Database (REACTOME) pathways significantly enriched in the DEGs uniquely regulated by FOXO1 in IL-4–stimulated STK11-deficient BMDMs. SRP, signal recognition particle. (I) Heatmap showing the expression of FOXO1-regulated metabolic genes in IL-4–stimulated WT and STK11-deficient BMDMs (n = 3). Data are representative of one [(A), (D), (E), (H), and (I)] or three [(B), (C), (F), and (G)] independent experiments and are presented as the means ± SEM. P values were calculated using one-way ANOVA with Tukey’s multiple comparison test [(F) and (G)]. *P < 0.05, **P < 0.01, ***P < 0.001, and ****P < 0.0001.
Fig. 6.
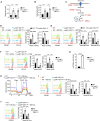
Fig. 6.. STK11 connects glutamine metabolism to modulate M2 macrophage polarization.
(A and B) Measurement of cellular glutamine (A) and glutamate (B) in WT and LysMCreStk11fl/fl BMDMs stimulated with vehicle or IL-4. (C) Schematic diagram of specific inhibitors targeting the glutamine transportation and catabolism pathway. (D to F) Comparison of CD206 and PD-L2 expression on IL-4–stimulated WT and STK11-deficient BMDMs treated with vehicle or V-9302 (D), or BPTES (E), or R162 (F) (WT with vehicle treatment (mock) is set to 1, n = 3). (G) Relative fold change of α-KG/Suc ratio in IL-4–stimulated WT and STK11-deficient BMDMs. (H) Measurement of OCR in WT and LysMCreStk11fl/fl BMDMs treated with mock or without DE-Suc in response to Oligo, FCCP, and R/A stimulation. (I and J) Comparison of CD206 and PD-L2 (I) and CD163 (J) expression on IL-4–stimulated WT and STK11-deficient BMDMs supplemented with mock or DE-Suc (WT with mock treatment is set to 1, n = 3). Data are representative of three independent experiments [(A), (B), and (D) to (J)] and are presented as the means ± SEM. P values were calculated using two-tailed Student’s t test [(A), (B), and (G)] or one-way ANOVA with Tukey’s multiple comparison test [(D) to (F), (I), and (J)]. *P < 0.05, **P < 0.01, ***P < 0.001, and ****P < 0.0001.
Fig. 7.
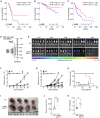
Fig. 7.. LysMCreStk11fl/fl mice display increased growth of orthotopic pancreatic tumors.
(A to C) Kaplan-Meier survival curves of patients with high (red) or low (blue) STK11 expression in pancreatic adenocarcinoma (PAAD) (A), uterine corpus endometrial carcinoma (UCEC) (B), and head and neck squamous cell carcinoma (HNSC) (C). (D) Experimental design for in vivo imaging system (IVIS) imaging of mice orthotopically inoculated Luc+ KPC tumor cells. (E) Bioluminescent images of WT and LysMCreStk11fl/fl mice bearing orthotopically inoculated Luc+ KPC tumors (n = 5 per group). (F) Bioluminescent analysis of KPC tumor growth in WT and LysMCreStk11fl/fl mice. (G) Growth of KPC tumors in WT and LysMCreStk11fl/fl individuals based on bioluminescent analysis (n = 5 per group). (H) Survival curves of the KPC tumor-bearing WT and LysMCreStk11fl/fl mice (n = 5 per group). (I) Representative images of KPC tumors from WT and LysMCreStk11fl/fl mice (n = 4 per group). (J and K) KPC tumor volume (J) and weight (K) from WT and LysMCreStk11fl/fl mice in (I). Data are from one experiment [(A) to (C) and (E) to (H)] or representative of two-independent experiments [(I) and (K)] and are presented as means ± SEM. P values were calculated using Log-rank test [(A) to (C) and (H)], two-way ANOVA with Bonferroni’s multiple comparison test (F), or two-tailed Student’s t test [(J) and (K)]. *P < 0.05, **P < 0.01, and ****P < 0.0001.
Fig. 8.
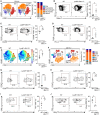
Fig. 8.. STK11-deficient TAMs acquire a M2-like phenotype in pancreatic cancer.
(A) t-SNE analysis (left) and stacked bar graph (right) of CD11B+ cell populations in KPC tumors from WT and LysMCreStk11fl/fl mice (n = 4 per group). (B) Percentages of eosinophils (Siglec-F+CD11b+) in KPC tumors from WT and LysMCreStk11fl/fl mice. (C and D) Percentages of F4/80+CD206+ (C) and F4/80+PD-L2+ (D) M2-like TAMs in KPC tumors from WT and LysMCreStk11fl/fl mice. (E) t-SNE analysis of IL-10–producing CD11b+ myeloid cells (left) and percentages of IL-10–producing macrophages (right) in KPC tumors from WT and LysMCreStk11fl/fl mice. (F) t-SNE analysis (left) and stacked bar graph (right) of CD11b cell populations in KPC tumors from WT and LysMCreStk11fl/fl mice. (G and H) Percentages of IOCS+Treg cells (G) and KLRG1+Treg cells (H) in KPC tumors from WT and LysMCreStk11fl/fl mice. (I) Flow cytometry analysis (left) and percentages (right) of PD-1–expressing CD8+ T cells in KPC tumors from WT and LysMCreStk11fl/fl mice. (J) Percentages of IFN-γ–expressing CD8 T cells in KPC tumors from WT and LysMCreStk11fl/fl mice. Data are representative of two independent experiments [(A) to (J)] and are presented as means ± SEM. P values were calculated using two-tailed Student’s t test [(B) to (D) and (G) to (J)]. *P < 0.05, **P < 0.01, and ***P < 0.001.

References

    1. Murray P. J., Wynn T. A., Protective and pathogenic functions of macrophage subsets. Nat. Rev. Immunol. 11, 723–737 (2011). - PMC - PubMed
    1. Davies L. C., Jenkins S. J., Allen J. E., Taylor P. R., Tissue-resident macrophages. Nat. Immunol. 14, 986–995 (2013). - PMC - PubMed
    1. Gordon S., Alternative activation of macrophages. Nat. Rev. Immunol. 3, 23–35 (2003). - PubMed
    1. Prokopchuk O., Liu Y., Henne-Bruns D., Kornmann M., Interleukin-4 enhances proliferation of human pancreatic cancer cells: Evidence for autocrine and paracrine actions. Br. J. Cancer 92, 921–928 (2005). - PMC - PubMed
    1. Vitale I., Manic G., Coussens L. M., Kroemer G., Galluzzi L., Macrophages and metabolism in the tumor microenvironment. Cell Metab. 30, 36–50 (2019). - PubMed

MeSH terms