. 2025 Sep 26;11(39):eadw9275.
doi: 10.1126/sciadv.adw9275. Epub 2025 Sep 26.

Reinforced plant-derived lipid nanoparticles for oral precise epigenome editing in colonic diseases

Affiliations

Reinforced plant-derived lipid nanoparticles for oral precise epigenome editing in colonic diseases

Qiang Gao et al. Sci Adv. .

Abstract

The clinical application of CRISPR-Cas9 remains limited by delivery challenges, particularly for oral administration. Lysine-specific demethylase 1 (Lsd1) plays a key role in colonic inflammation and tumorigenesis. Here, we developed an oral genome-editing platform (TPGS-RNP@LNP), where Lsd1-targeting ribonucleoproteins (RNPs) were encapsulated in mulberry leaf lipid nanoparticles (LNPs) and formulated with d-α-tocopherol polyethylene glycol succinate (TPGS). TPGS reinforced the lipid bilayer of LNPs, enhanced gastrointestinal stability, and facilitated colonic mucus penetration. Upon the galactose receptor-mediated endocytosis of TPGS-RNP@LNPs by macrophages, their fusion with the endosomal membrane and the presence of nuclear localization signals ensured the nuclear delivery of RNPs. TPGS-RNP@LNPs achieved 59.7% Lsd1 editing efficiency in macrophages, surpassing the commercial CRISPRMAX (43.0%). Oral TPGS-RNP@LNPs promoted H3K4 methylation to modulate epigenetic states, achieving inflammation mitigation, epithelial barrier restoration, and retardation of colitis and its associated tumorigenesis. As an LNP-based oral RNP delivery system, TPGS-RNP@LNPs provide a promising platform for precise treatment of colorectal diseases.


Figures
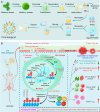
Fig. 1.
Fig. 1.. Schematic illustration of efficient RNP delivery to enable cell-specific genome editing and precise treatment of colonic diseases mediated by TPGS@LNPs.
(A) Fabrication procedure of TPGS-RNP@LNPs. Created in BioRender. Q. Gao (2025); https://biorender.com/ehl3wlp. (B) Illustration of oral targeted delivery of TPGS-RNP@LNPs mediating specific genome editing in colonic epithelial cells and macrophages for treating UC and CAC. Upon oral administration, TPGS-RNP@LNPs can be efficiently internalized by colonic epithelial cells and preferably target macrophages via galactose receptor–mediated endocytosis following stable traversal of the GI tract and mucus barrier. Subsequently, the RNPs delivered by TPGS-RNP@LNPs are released and translocated into the nucleus through membrane fusion, enabling efficient genome editing. This process enhances H3K4 mono- and dimethylation, which modulates the transcription of multiple anticolitis genes and restores the expression of tight junction– and mucus-associated proteins. Consequently, the damaged intestinal epithelial barrier is repaired, the inflammatory response is mitigated, and inflammation-induced tumor growth is inhibited, eventually achieving the effective treatment of UC and CAC. Created in BioRender. Q. Gao (2025); https://biorender.com/5rwjer6.
Fig. 2.
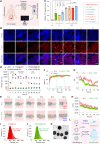
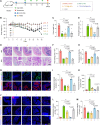
Fig. 2.. Expression profiles of LSD1 in the human colonic tissues and physicochemical characterization of various LNPs.
(A) Schematic illustration of specimen collection, sectioning, immunostaining, and imaging of human colonic tissues. Created in BioRender. Q. Gao (2025); https://biorender.com/zj6xl1h. (B) Fluorescence images and (C) the corresponding quantitative analysis of LSD1 protein in the human colonic tissue sections from patients at different stages of UC and CAC (n = 3). Scale bar, 200 μm. (D) Stabilities of LNPs, TPGS@LNPs, TPGS-RNP@LNPs, Lipo6000-RNP@LNPs, and CMAX-RNP@LNPs in the simulated gastric, small intestinal, and colonic fluids (n = 3). h, hours. (E) Optimization process of dynamics simulation of MLLs with or without the addition of TPGS in an aqueous solvent box. TPGS, MGDG, PG, FA, and OAHFA are represented in green, blue, purple, yellow, and blue-gray, respectively. (F) Root mean square deviation (RMSD; T1: equilibrium time for MLLs + TPGS; T2: equilibrium time for MLLs; ΔT = T2T1), (G) radius of gyration (RG), and (H) surface area (SA) values of MLLs with or without the addition of TPGS. Particle size distribution profiles of (I) TPGS@LNPs and (J) TPGS-RNP@LNPs. (K) Transmission electron microscopy images of TPGS-RNP@LNPs. Scale bar, 100 nm. (L) Schematic diagram illustrating the substantial enhancement in the GI stability of mulberry leaf–derived LNPs after adding TPGS. Created in BioRender. Q. Gao (2025); https://biorender.com/2g70ixm. Data are the means ± SEM. *P < 0.05, **P < 0.01, ***P < 0.001, and ****P < 0.0001.
Fig. 3.
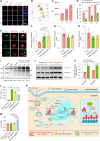
Fig. 3.. In vitro cell internalization, Lsd1 knockout efficiency, and anti-inflammatory activity of various LNPs.
(A) Intracellular distribution of TPGS-RNP@LNPs in macrophages after 1, 3, and 5 hours of incubation. Scale bars, 20 μm (small field) and 5 μm (large field). (B) Flow cytometric histograms and (C) MFIs of macrophages treated with TPGS-RNP@LNPs at corresponding time points (n = 3). (D) Cellular uptake of TPGS-RNP@LNPs by macrophages with or without d-galactose at 1, 3, and 5 hours (n = 3). (E) CLSM images of macrophages after incubation with TPGS-RNP@LNPs for 1, 4, and 8 hours and staining with LysoTracker Red. Scale bar, 5 μm. (F to H) Relative expression of Npc1, Lamp1, and Lamp2 of macrophages after 48 hours of treatment with TPGS@LNPs or TPGS-RNP@LNPs (n = 3). (I) T7E1 assay of Lsd1 locus in macrophages following 48 hours of treatment with CMAX and TPGS-RNP@LNPs. (J and K) Western blot and quantifications of H3K4Me1/Me2 in macrophages after 48 hours of incubation with TPGS@LNPs and TPGS-RNP@LNPs, respectively (n = 3). (L and M) TNF-α and IL-10 levels in supernatants of macrophages that received the treatment of various LNPs for 48 hours. Untreated and lipopolysaccharide-treated macrophages served as negative and positive controls, respectively. Both TPGS@LNP and TPGS-RNP@LNP groups were also treated with lipopolysaccharide (500 μl, 0.5 μg/ml) (n = 3). (N) Schematic diagram illustrating the mechanism by which TPGS-RNP@LNPs mediate Lsd1 gene editing via galactose receptor–mediated endocytosis and efficient endosomal escape, thereby enhancing H3K4 mono- and dimethylation levels and eventually achieving inflammation alleviation. Created in BioRender. Q. Gao (2025); https://biorender.com/96n5xz9. Data are the means ± SEM. *P < 0.05, **P < 0.01, ***P < 0.001, and ****P < 0.0001; ns, no significance.
Fig. 4.
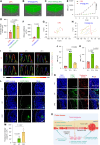
Fig. 4.. Mucus penetration and in vivo biodistribution profiles of various LNPs.
3D mucus penetration images of (A) LNPs, (B) TPGS@LNPs, and (C) TPGS-RNP@LNPs. Scale bar, 200 μm. (D) Corresponding penetration depths of LNPs, TPGS@LNPs, and TPGS-RNP@LNPs (n = 3). (E) Mean square displacement (MSD) values and (F) diffusion coefficients of LNPs and TPGS@LNPs within the mucus-simulating hydrogel (n = 3). Motion trajectories of (G) naked LNPs and (H) TPGS@LNPs in the mucus-simulating hydrogel (n = 7). (I) Ex vivo fluorescence profiles of the GI tract from UC and CAC mice that received oral administration of TPGS-RNP@LNPs at different time points (6, 12, and 24 hours). Quantification of the relative MFIs of colon tissues from (J) UC mice and (K) CAC mice using ImageJ software in (I) (n = 3). (L) CLSM images of colonic tissue sections from the healthy, UC, and CAC mice after oral administration of TPGS-RNP@LNPs for 24 hours. Scale bar, 100 μm. (M) Quantifying the relative EGFP expression levels in the colonic tissues using ImageJ software in (L) (n = 3). (N) CLSM images of colonic tissue sections from the healthy, UC, and CAC mice after oral administration of TPGS-RNP@LNPs for 24 hours. Scale bar, 100 μm. Macrophages were visualized using an Alexa Fluor 647–labeled F4/80 antibody. (O) Schematic illustration of TPGS enhancing the mucus infiltration and lesion accumulation of TPGS-RNP@LNPs. Created in BioRender. Q. Gao (2025); https://biorender.com/m5s4z5f. Data are the means ± SEM. *P < 0.05, **P < 0.01, and ***P < 0.001.
Fig. 5.
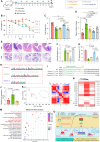
Fig. 5.. In vivo retardation effect of oral LNPs on UC progression.
(A) Schematic representation of the treatment protocol. (B) Variations in mouse body weight across all groups throughout the entire study period (n = 6). (C) Colon lengths and (D) spleen coefficients of various groups at the end of experiments (n = 6). (E) H&E and PAS staining of the colonic tissues from mice in all experimental groups. Scale bar, 100 μm. Quantitative results of (F) H&E and (G) PAS staining of the colonic tissues (n = 3). (H) Representative Sanger sequencing results and (I) indel mutations of the Lsd1 locus of T-A cloning from the colonic tissues after co-incubation with TPGS-RNP@LNPs for 48 hours. (J) Relative expression levels of Lsd1 in the colonic tissues from different mouse groups (n = 3). (K) Principal components analysis from mice in the healthy control, DSS control, and TPGS-RNP@LNP groups (n = 4). (L) The heatmap illustrates the correlations between different groups (n = 4). (M) KEGG enrichment analysis between the TPGS-RNP@LNP group and the DSS control group. (N) The heatmap illustrates the expression levels of chemokines, inflammatory factors, colony-stimulating factors, and Ifi47 in different mouse groups (n = 4). (O) Molecular mechanism underlying the inhibitory effect of TPGS-RNP@LNPs on the progression of UC. Created in BioRender. Q. Gao (2025); https://biorender.com/u8i27zv. Data are the means ± SEM. *P < 0.05, **P < 0.01, ***P < 0.001, and ****P < 0.0001.
Fig. 6.
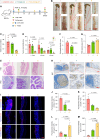
Fig. 6.. In vivo therapeutic outcomes of oral LNPs against UC.
(A) Protocol for the establishment of UC mouse models and treatment procedures. (B) Mouse body weight variations during the entire investigation (n = 5). (C) Colon lengths of various treatment groups at the end of experiments (n = 5). (D) H&E and PAS staining of the colonic tissues. Scale bar, 100 μm. Quantitative analysis of (E) H&E and (F) PAS staining of the colonic tissues (n = 3). (G) Immunofluorescence staining of ZO-1 and MUC2 in the colonic tissue sections. Scale bar, 100 μm. Quantitative fluorescence analysis of (H) ZO-1 and (I) MUC2 in the colonic tissues (n = 3). (J) Immunofluorescence staining of CD4+ T cells, CD8+ T cells, and Foxp3+ Treg cells in the colonic tissues. Scale bar, 100 μm. Corresponding fluorescence quantification of (K) CD4+ T cells, (L) CD8+ T cells, and (M) Foxp3+ Treg cells in the colonic tissues (n = 3). Data are the means ± SEM. *P < 0.05, **P < 0.01, ***P < 0.001, and ****P < 0.0001.
Fig. 7.
Fig. 7.. In vivo inhibitory effect of orally administered LNPs on CAC progression.
(A) Schematic diagram of CAC model establishment and treatment protocol. ip, intraperitoneally. (B) Photographs of colon tumors. Scale bars, 0.5 cm. (C) Total tumor numbers and (D) tumor size distributions across various treatment groups at the end of experiments (n = 6). (E) H&E and PAS staining of colonic tissues. Scale bar, 100 μm. (F) Corresponding histopathological scores of colonic tissues from all treatment groups (n = 3). (G) Corresponding PAS staining area of colonic tissues from all treatment groups (n = 4). (H) Ki67 staining of colonic tissues. The scale bars for the small field and large field of the images are 100 and 50 μm, respectively. (I) Immunofluorescence staining of CD4+ T cells, CD8+ T cells, and Foxp3+ Treg cells in colonic tissue samples. Scale bar, 100 μm. Quantitative fluorescence analysis of (J) CD4+ T cells, (K) CD8+ T cells, (L) Foxp3+ Treg cells, and (M) ZO-1 expression in the colonic tissues (n = 3). Data are the means ± SEM. *P < 0.05, **P < 0.01, and ***P < 0.001.

References

    1. Gros B., Kaplan G. G., Ulcerative colitis in adults: A review. JAMA 330, 951–965 (2023). - PubMed
    1. Li X. V., Leonardi I., Putzel G. G., Semon A., Fiers W. D., Kusakabe T., Lin W. Y., Gao I. H., Doron I., Gutierrez-Guerrero A., DeCelie M. B., Carriche G. M., Mesko M., Yang C., Naglik J. R., Hube B., Scherl E. J., Iliev I. D., Immune regulation by fungal strain diversity in inflammatory bowel disease. Nature 603, 672–678 (2022). - PMC - PubMed
    1. Gillmore J. D., Gane E., Taubel J., Kao J., Fontana M., Maitland M. L., Seitzer J., O’Connell D., Walsh K. R., Wood K., Phillips J., Xu Y., Amaral A., Boyd A. P., Cehelsky J. E., McKee M. D., Schiermeier A., Harari O., Murphy A., Kyratsous C. A., Zambrowicz B., Soltys R., Gutstein D. E., Leonard J., Sepp-Lorenzino L., Lebwohl D., CRISPR-Cas9 in vivo gene editing for transthyretin amyloidosis. N. Engl. J. Med. 385, 493–502 (2021). - PubMed
    1. Liu Y., Zeng Y., Liu L., Zhuang C., Fu X., Huang W., Cai Z., Synthesizing and gate genetic circuits based on CRISPR-Cas9 for identification of bladder cancer cells. Nat. Commun. 5, 5393 (2014). - PubMed
    1. Zuris J. A., Thompson D. B., Shu Y., Guilinger J. P., Bessen J. L., Hu J. H., Maeder M. L., Joung J. K., Chen Z. Y., Liu D. R., Cationic lipid-mediated delivery of proteins enables efficient protein-based genome editing in vitro and in vivo. Nat. Biotechnol. 33, 73–80 (2015). - PMC - PubMed

LinkOut - more resources