. 2025 Sep 26;12(9):ENEURO.0153-25.2025.
doi: 10.1523/ENEURO.0153-25.2025. Print 2025 Sep.

Spatial Attention Weakly Modulates Visual Responses in the Lateral Geniculate Nucleus

Affiliations

Spatial Attention Weakly Modulates Visual Responses in the Lateral Geniculate Nucleus

Henry J Alitto et al. eNeuro. .

Abstract

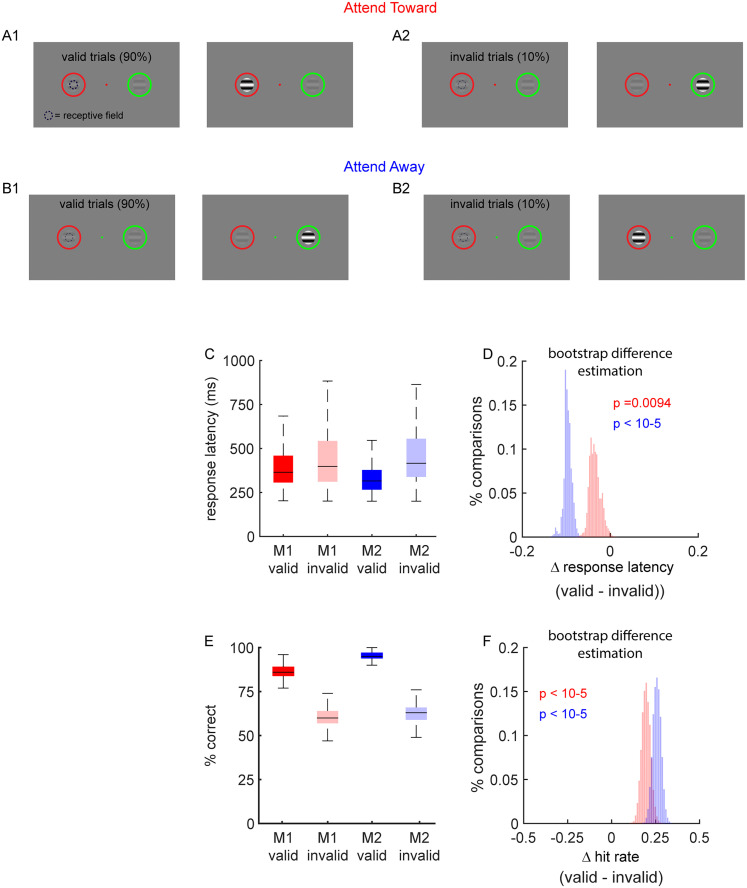
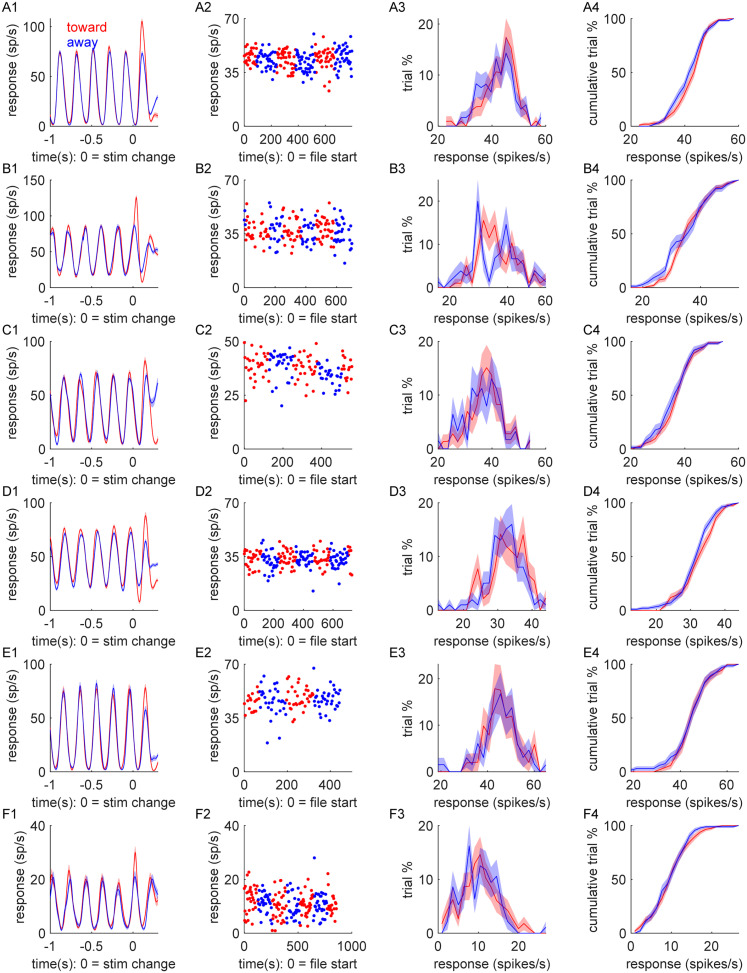
Visual responses in the cortex are strongly influenced by shifts in spatial attention. This modulation of visual processing includes changes in firing rate, decreased response variability, and decreased interneuronal correlations; all of which are thought to underlie enhanced perception near the center of attention at the cost of perception at other locations. Information from the retina is relayed to primary visual cortex via neurons in the lateral geniculate nucleus (LGN) of the thalamus. Although early studies describe an enhancement of LGN activity with spatial attention, more recent work has cast doubt on this view. Given its strategic position as the gateway to the cortex, an understanding of the effects of attention on visual processing in the LGN is important. We therefore performed experiments to reexamine the influence of spatial attention on spiking activity in macaque LGN (one male, one female) and applied a broad set of analyses and functional metrics to assess possible effects. Our results reveal a statistically significant effect of spatial attention in the LGN: firing rates were slightly higher and more reliable when monkeys directed attention toward the receptive fields of recorded neurons compared with when attention was directed to different retinotopic locations. However, effects were much smaller than previously reported (∼1 vs ∼4%) and further analyses suggest that effects are weak, inconsistent, and restricted to a small subset of parvocellular and magnocellular neurons. Thus, while spatial attention does exert an influence in the LGN, its effects are weak and may have limited impact on downstream processing.

Keywords: cortex; thalamus.


Conflict of interest statement

The authors declare no competing financial interests.

Figures

Figure 1.
Figure 1.
Spatial attention task and psychophysical measure of spatial attention. Two macaque monkeys (Monkey 1, M1, and Monkey 2, M2) were trained to perform a covert spatial attention task. A, B, On each trial, animals maintained fixation on a central green dot while two peripheral sine wave gratings appeared, each surrounded by a colored circle. One grating was positioned over the RF of a recorded LGN neuron (dashed black circle) and the other at an equidistant location. The color of the fixation point, in conjunction with the colors of the peripheral circles, indicated the probability that each grating would undergo a contrast increase after a brief delay. In 90% of trials (A1, B1), termed “valid trials,” the contrast change occurred at the location where the circle color matched the fixation cue. In 10% of trials (A2, B2), termed invalid trials, the contrast change occurred at the nonmatching location. Since one stimulus was positioned inside the RF and one was positioned outside the RF, trials were further categorized based on the spatial relationship between the cued location and the RF. “Attend-toward” trials (A) occurred when the cued stimulus was positioned inside the RF, while “attend-away” trials (B) occurred when the cued stimulus was positioned away from the RF. The error bars in C and B indicate the 25th and 75th percentiles. Animals were rewarded for making a saccade to the grating that increased in contrast. Both animals respond faster (C, D) and more accurately (E, F) on valid trials compared with invalid trials. Statistical significance was assessed using BDE. Panels D and F show the distribution of median differences (valid–invalid) computed over 10,000 bootstrap resamples for M1 (red) and M2 (blue). These distributions provide graphical estimates of the effect size, variability, and statistical confidence (see Methods and Materials for details).
Figure 2.
Figure 2.
Single-unit examples of LGN responses recorded while the animal performed the spatial attention task. Each row (A–F) shows data from one neuron. Column 1. Peristimulus time histograms (PSTHs) showing firing rates for valid attend-toward (red) and attend-away (blue) trials, aligned to the time of contrast change (0 s). Column 2. The mean firing rate across all trials as a function of time relative to the start of recording. Column 3. Distribution of firing rates (F1) across all trials. Column 4. Cumulative distribution of firing rates across all trials. In all panels, the shaded areas indicate standard error of the mean.
Figure 3.
Figure 3.
The firing rate during spatial attention. A, Distribution of firing rates (F1) for attend-toward versus attend-away trials across all cells (M1 = red; M2 = blue; n = 283). B, Significance of these effects was determined via a BDE (see Materials and Methods). The red and blue data in panel B show the distribution of median difference values (toward–away) over 10,000 resamples with replacement for M1 and M2, respectively. These distributions provide a direct graphical illustration of statistical significance and confidence intervals (p values in text). C, D, Same as A and B for parvocellular (red) and magnocellular (blue) data. E, F, Same as A and B for on-center (red) and off-center (black).
Figure 4.
Figure 4.
Attention index. A, Distribution of attention index values across cell types (error bars = 25th and 75th percentiles). B, Overall distribution of attention index values. Significant values (p < 0.05) are indicated in black. C, Significance of the distribution of attention index values (positive > negative) was determined by a bootstrap null distribution analysis (red dashed line = observed difference). D, Distribution of attention index values for M1 (red) and M2 (blue) (0 = black dashed line). E, Significance of these distributions was determined via a bootstrap mean estimation. F, G, Same as D and E for parvocellular (red) and magnocellular (blue) data. H, I, Same as A and B for on-center (red) and off-center (black) data.
Figure 5.
Figure 5.
Equivalent contrast change. A, Population contrast response functions for parvocellular (red) and magnocellular (blue) data (shaded area = standard error of the mean). B, C, Distribution of equivalent contrast values across cell types (error bars = 25th and 75th percentiles). D, Significance of these distributions was determined via a bootstrap mean estimation.
Figure 6.
Figure 6.
ROC analysis of spatial attention. A, AUC for attend-toward trials versus baseline, across cell types. B, AUC for attend-away trials versus baseline, across cell types. C, AUC for attend-toward trials versus attend-away trials, across cell types. D, Distribution of AUC values for M1 (red = toward vs baseline; blue = away vs baseline; black = toward vs away). E, Same as D for M2. F, Same as D for parvocellular data. G, Same as D for magnocellular data.
Figure 7.
Figure 7.
Thalamic bursts during spatial attention. A, Distribution of thalamic burst percentage for attend-toward trials versus attend-away trials. B, Sample distributions for burst index values across cell types. C, D, Significance of these effects illustrated via a BDE. E, Correlation between burst percentage and firing rate across all cell types (red = attend-toward trials; blue = attend-away trials; dashed line = linear fit). F, Significance of these correlations illustrated via a bootstrap mean estimation.
Figure 8.
Figure 8.
Response reliability during spatial attention. A, Distribution of Fano factor values for attend-toward trials versus attend-away trials. B, Sample distributions for Fano factor index values across cell types. C, D, Significance of these effects as illustrated via a BDE.
Figure 9.
Figure 9.
LGN population activity is weakly modulated by spatial attention. SVM models were used to assess whether population-level activity in the LGN could predict the subject's attentional state. AC, Distributions of classification performance (AUC) for SVM models trained on pseudopopulations that preserved cell identity (red), compared with shuffled-label controls (blue). DF, Same analysis as in AC but using “pooled” pseudopopulations in which cell identity was randomized. The sharp drop in performance suggests that the attentional signal is not broadly distributed across the population.
Figure 10.
Figure 10.
A minority of LGN neurons carry the attentional signal. SVM models were iteratively ablated to assess the relative contribution of individual neurons to the population-level attentional signal. A, “Greedy ablation” analysis: the most informative neurons were progressively removed from the model. AUC is plotted as a function of ablation number (0 = full dataset). Shaded areas show ±1 standard deviation across bootstrap iterations. B, AUC distribution for the full model (198 neurons). C, AUC distribution after 20 greedy ablations, demonstrating a drop to chance performance. D, “Reverse greedy ablation” analysis: the least informative neurons were progressively removed. Classifier performance increased as uninformative neurons were removed, peaking with ∼18% of the neurons remaining. E, AUC distribution for the full model. F, AUC distribution after 141 ablations, corresponding to peak model performance.

References

    1. Alitto HJ, Usrey WM (2004) Influence of contrast on orientation and temporal frequency tuning in ferret primary visual cortex. J Neurophysiol 91:2797–2808. 10.1152/jn.00943.2003 - DOI - PubMed
    1. Alitto H, Rathbun DL, Vandeleest JJ, Alexander PC, Usrey WM (2019) The augmentation of retinogeniculate communication during thalamic burst mode. J Neurosci 39:5697–5710. 10.1523/JNEUROSCI.2320-18.2019 - DOI - PMC - PubMed
    1. Alitto HJ, Moore BD, Rathbun DL, Usrey WM (2011) A comparison of visual responses in the lateral geniculate nucleus of alert and anaesthetized macaque monkeys. J Physiol 589:87–99. 10.1113/jphysiol.2010.190538 - DOI - PMC - PubMed
    1. Baldwin MKL, Balaram P, Kaas JH (2017) The evolution and functions of nuclei of the visual pulvinar in primates. J Comp Neurol 525:3207–3226. 10.1002/cne.24272 - DOI - PubMed
    1. Bonin V, Mante V, Carandini M (2005) The suppressive field of neurons in lateral geniculate nucleus. J Neurosci 25:10844–10856. 10.1523/JNEUROSCI.3562-05.2005 - DOI - PMC - PubMed