. 2025 Sep 26;16(1):8473.
doi: 10.1038/s41467-025-63339-9.

Distinct cell state ecosystems for nodular lymphocyte-predominant Hodgkin lymphoma

Affiliations

Distinct cell state ecosystems for nodular lymphocyte-predominant Hodgkin lymphoma

Ajay Subramanian et al. Nat Commun. .

Abstract

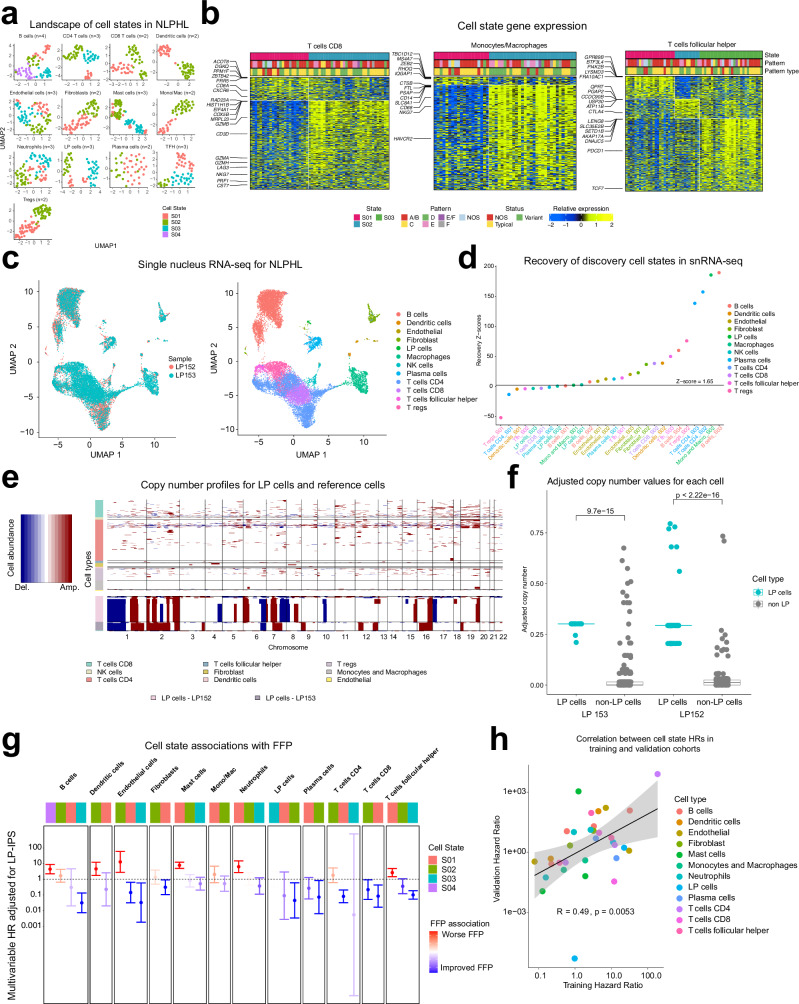
Nodular lymphocyte-predominant Hodgkin lymphoma (NLPHL) is a rare cancer, and few studies have comprehensively investigated the immune microenvironment and rare lymphocyte-predominant (LP) cells. Here we develop a NLPHL specific lymphocyte-predominant ecotype (LPE) model to identify 34 distinct cell states across 14 cell types that co-occur within 3 LPEs for 171 cases. LPE1 and LPE2 were characterized by immunosuppressive microenvironments with high expression of B2M on LP cells, CD8 T-cell exhaustion, immune checkpoint genes expressed by follicular T-cells, and an improved freedom from progression compared to LPE3 in training (n = 109, with 65% LPE1/2) and validation cohorts (n = 62, with 61% LPE1/2). We validate the co-occurrence and co-localization of cell states using spatial transcriptomics. Protein expression of HLA-I and HLA-II on LP cells and SSTR2 on dendritic cells was predictive of LPE1 (C-statistic=0.69), LPE2 (C-statistic=0.79), and LPE3 (C-statistic=0.60). This study establishes a clinically relevant biologic categorization for NLPHL.


Conflict of interest statement

Competing interests: H.M. reports consulting and honoraria with Lilly, Bristol-Myers Squibb, Abbvie, and Roche. M.D. reports research funding from AstraZeneca, Genentech, Varian Medical Systems and Illumina, ownership interest in CiberMed and Foresight Diagnostics, consultancy from AstraZeneca, Boehringer Ingelheim, BMS, Genentech, Gritstone Oncology, Illumina, Regeneron and Roche, and multiple issued and pending patents including patents licensed to Foresight Diagnostics and Roche. A.A.A. reports consultancy for Celgene, Chugai, Genentech, Gilead, Janssen, Pharmacyclics and Roche, scientific advisory board membership in the Lymphoma Research Foundation, and Professional Affiliations with the American Society of Hematology, American Society of Clinical Oncology, American Society of Clinical Investigation, Leukemia & Lymphoma Society, Research Funding from the National Cancer Institute, the National Heart, Lung, and Blood Institute, the US National Institutes of Health, Celgene, BMS and Pfizer, patent filings including patent issued, licensed and with royalties paid from FortySeven, a patent pending and Licensed to Foresight, a patent pending relating to MARIA, a patent issued and licensed to CiberMed, a patent issued and a patent pending to CiberMed, patents issued to Idiotype Vaccines, and a patent issued, licensed and with royalties paid from Roche, and equity ownership interests in CiberMed Inc., ForeSight Diagnostics, FortySeven Inc. and CARGO Therapeutics. The remaining authors declare no competing interests.

Figures

Fig. 1
Fig. 1. Framework to identify and validate the landscape of cell states and ecosystems for nodular lymphocyte-predominant Hodgkin lymphoma (NLPHL).
A schematic displaying the approaches taken to genotype the malignant lymphocyte-predominant (LP) cells, characterize the immune microenvironment, and finally measure B-cell and T-cell receptor diversity within tissue samples. Laser capture microdissection was used to isolate LP cells with subsequent pooling, DNA isolation, and genotyping via targeted hybrid capture assay. Bulk RNA-seq was subsequently performed on patient tissue samples for training (n = 109) and validation (n = 62) cohorts with digital deconvolution, cell state identification, and ecosystem (EcoTypes) delineated via machine learning algorithms. The cell states were validated for two samples using single nucleus RNA-seq with proximity assessed using spatial transcriptomics for 6 samples. Finally, protein expression of the LP cells may infer LPE.
Fig. 2
Fig. 2. Digital deconvolution of bulk RNA-seq data allows for measurement of cell-type abundance and cell-specific expression.
a A multiplexed immunofluorescent platform (CODEX) was used to measure cell abundances to serve as a reference to benchmark bioinformatic methods (4 regions of interest per case). b Correlation of cell abundances obtained for 6 cases with 4 regions of interest selected per case using CODEX versus values obtained using CIBERSORTx (two-sided Wilcoxon rank sum P value and linear regression correlation). c Cell abundance as measured by CIBERSORTx for 14 cell types for each sample in the training cohort (n = 109) stratified by immunoarchitectural pattern with statistical significance of differences across patterns (ANOVA P value was calculated to compare abundances across patterns). d Average cell abundances measured across immunoarchitectural patterns.
Fig. 3
Fig. 3. Genotyping of LP cells from cellular DNA using laser capture microdissection and circulating tumor DNA.
a A representative NLPHL tissue sample with the LP cells outlined in red which were subsequently microdissected. Approximately 200 LP cells per tissue sample were isolated and pooled for DNA isolation, library preparation and sequencing. b Oncoprint demonstrates the recurrent somatic tumor mutations enriched in microdissected tissue or ctDNA as compared to the allele frequency found when performing bulk DNA-seq. c Scatterplot shows strong correlation between 2*single nucleotide variant allele frequency value versus LP cell abundance as measured via CIBERSORTx (linear regression correlation and two-sided P value calculated by Wilcoxon rank sum).
Fig. 4
Fig. 4. Identification of cell states within the training cohort.
a Using the machine learning algorithm EcoTyper, UMAPs show a range of 2–4 cell states observed for LP and 13 immune cell types resulting in a total of 34 cell states. b Gene expression heatmaps demonstrate characteristic gene expression profiles for cell states observed for CD8 T-cells, Macophages, and Tfh cells. c UMAPs demonstrate the representation of isolated nuclei (left) and the assigned cell types obtained from snRNA-seq (right). d Nearly all cell states from NLPHL EcoType 2 or in high abundance within two snRNA-seq samples are significantly recovered (permutation testing yielded z scores which were combined into a meta z score using Stouffer’s method where z scores > 1.65 [one sided P < 0.05] were deemed significant). e Copy number alterations are more frequent for LP versus immune cell types across the genome. f Scatter box plot shows increased copy number alterations versus benign cells. (two-sided Wilcoxon rank sum P values and box plot shows the median along with the interquartile range overlayed with the dot plot of all values) g Cell state associations adjusted by the LP-IPS for samples in the training cohort (n = 109) (multivariable Cox proportional hazards models adjusted for LP-IPS with error bars representing 95% confidence intervals). h The hazard ratios obtained for the validation cohort (n = 62) significantly correlate with the values obtained for the training cohort (g) (multivariable Cox proportional hazards models adjusted for LP-IPS were used along with Spearman correlation, shaded standard error bands, and two-sided Wilcoxon rank sum P values).
Fig. 5
Fig. 5. Characterization of cell state ecotypes and association with freedom from progression.
a Only a minority of NLPHL samples have microenvironmental cell states that overlap with other B-cell lymphomas and lymphoid proliferations as defined by Lymphoma EcoTyper (thickness of band represents percent of samples). b Heatmap demonstrates abundance of cell state phenotypes and clustering into three lymphocyte-predominant ecotypes (LPE). c Network plots demonstrate the ecotype defining cell states for the LPE model (Jaccard index values were calculated for the length of the edges). d Abundance of cell types stratified by LPE. e Riverplot shows a fairly uniform distribution of immunoarchitectural patterns represented within each LPE (thickness of band represents percent of patients within each category). f Multivariable Cox regression models adjusted for the LP-IPS show LPE3 is associated with significantly worse freedom from progressive lymphoma following definitive treatment in the training (top) and validation (bottom) cohorts. (multivariable Cox regression models adjusted for LP-IPS with error bars represented as 95% confidence intervals) g Receiver-operator-characteristics curves show LPE3 abundance improves prediction of relapse by 7% and 16% for the training (top) and validation cohorts (bottom), respectively (area under the curve values shown). Kaplan-Meier curves demonstrate patients with high LPE3 classification have worse freedom from progressive lymphoma after definitive treatment in the training (h) and validation (i) cohorts (two sided P values are calculated by log-rank test).
Fig. 6
Fig. 6. Spatial validation of cell states and cellular proximity.
a Spatial transcriptomics via the Visium platfrom (10X genomics) demonstrates LPE abundance per spot with increasing LPE3 abundance moving from left to right along the top panel. LP abundance per spot are shown in the middle row. B2M expression per spot is shown on the bottom row. b Correlation matrix between immunohistochemical antibody markers and LP cell states and lymphocyte-predominant ecotypes. c Representative examples for patients with NLPHL with LP cell negativity and positivity for B2M for the top (LPE3) and bottom (LPE1) panels respectively. d Schematic algorithm demonstrating the use of protein expression markers to infer LPE. e Logistic regression models to predict LP cell states and LP ecotype 3 using protein expression for HLA-I, and HLA-II on LP cells and SSTR2 on dendritic cells (area under the curve values displayed next to LP states and LPEs).
Fig. 7
Fig. 7. Reconstruction of B-cell and T-cell receptor sequences from RNA-seq data with assessment of diversity across ecotypes and relapse cases.
a Diversity measured by Shannon entropy for BCR and TCR reads were significantly lower in relapsed versus no-relapse samples. b Similarly, there was a reduced diversity of unique TCR motifs by Shannon entropy for relapse versus no relapse samples using the GLIPH2 algorithm. c Diversity of BCR and TCR reads by Shannon entropy were significantly lower in LPE2 and LPE3 versus LPE1. d Similarly, the diversity of unique motifs per sample was lower for LPE3 and LPE2 versus LPE1 using GLIPH2. For (ad), the middle line represents the median value and IQR for the boxplot with whiskers determined by Tukey method. The P values are obtained from two-sided Wilcoxon rank-sum tests.

References

    1. Swerdlow, S. H. et al. The 2016 revision of the World Health Organization classification of lymphoid neoplasms. Blood127, 2375–2390 (2016). - PMC - PubMed
    1. Younes, S., Rojansky, R. B., Menke, J. R., Gratzinger, D. & Natkunam, Y. Pitfalls in the diagnosis of nodular lymphocyte predominant Hodgkin lymphoma: variant patterns, borderlines and mimics. Cancers13, 3021 (2021). - PMC - PubMed
    1. Campo, E. et al. The international consensus classification of mature lymphoid neoplasms: a report from the clinical advisory committee. Blood. 10.1182/blood.2022015851 (2022). - PMC - PubMed
    1. Regula, D. P., Hoppe, R. T. & Weiss, L. M. Nodular and diffuse types of lymphocyte predominance Hodgkin’s disease. N. Engl. J. Med318, 214–219 (1988). - PubMed
    1. Eichenauer, D. A. et al. Long-term follow-up of patients with nodular lymphocyte-predominant Hodgkin lymphoma treated in the HD7 to HD15 trials: a report from the German Hodgkin Study Group. J. Clin. Oncol.10.1200/JCO.19.00986 (2019). - PubMed