. 2025 Sep 26;16(1):8477.
doi: 10.1038/s41467-025-63371-9.

Spatially-restricted inflammation-induced senescent-like glia in multiple sclerosis and patient-derived organoids

Affiliations

Spatially-restricted inflammation-induced senescent-like glia in multiple sclerosis and patient-derived organoids

Francesca Fagiani et al. Nat Commun. .

Abstract

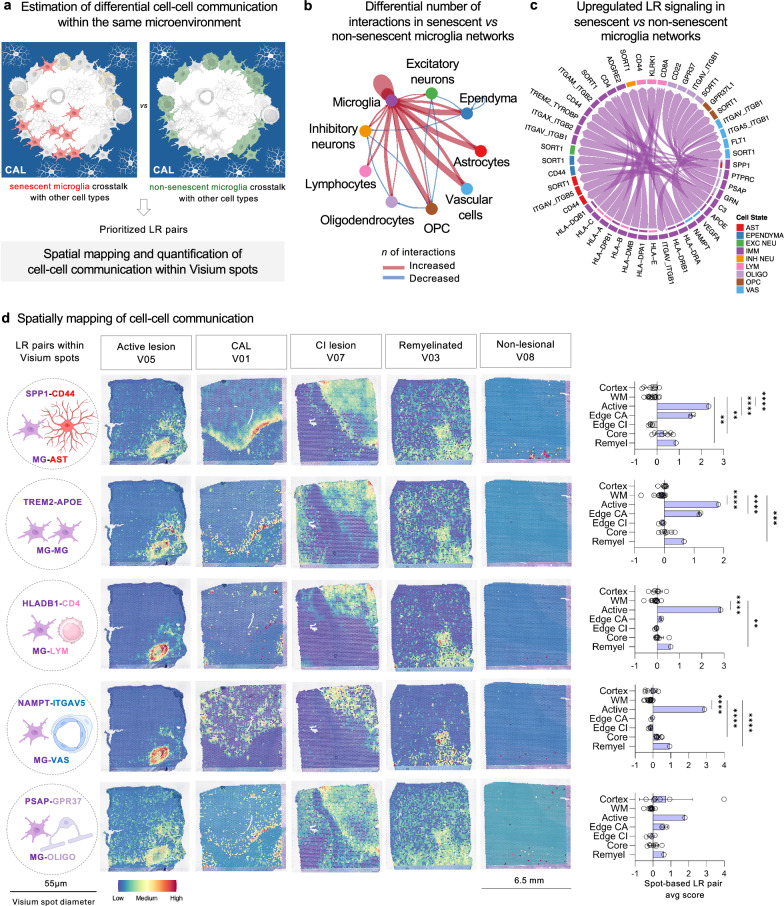
In multiple sclerosis (MS), chronic compartmentalized inflammation is thought to drive relentless clinical deterioration. Here, we investigate the link between unresolved parenchymal inflammation and cellular senescence in MS progression. Single-cell transcriptomic analysis of human brain tissue reveals an accumulation of senescent-like glial cells in diseased white matter, especially in chronic active lesions, and to a lesser extent in the cortex. Spatial transcriptomics show gradients of senescence-like signatures extending from lesion cores to periplaque regions, alongside rewired cellular networks. Experimental induction of senescence in MS hiPSC-derived neural organoids demonstrates that microglia are especially vulnerable to inflammation-induced senescence, which can be partially rescued by CNS-penetrant anti-inflammatory drugs. At the patient level (n = 466), increased 3T MRI-estimated brain-age is observed, especially in individuals with more than four chronic active lesions. These findings suggest that chronic inflammation might accelerate senescence-like processes, potentially contributing to disease progression, and that its modulation might help limit further propagation.


Conflict of interest statement

Competing interests: P.A.C. received research funding from Genentech and consulting honoraria for serving on advisory boards for Idorsia Spolia Therapeutics and Lilly. P.M. received consulting and/or speaker honoraria from Sanofi, Biogen, and Merck. D.S.R. received research funding from Abata Therapeutics and Sanofi. M.A. received consulting and/or speaker honoraria from GSK, Sanofi, Biogen, Immunic Therapeutics, Viatris, and Abata Therapeutics. All other authors report no relevant declaration of interest.

Figures

Fig. 1
Fig. 1. Profiling of pathological stage- and location-specific cell types in MS brain tissue vs. non neurological controls.
a Study design for punch-based sampling of brain tissues (cortex and WM at different locations and pathological stages, i.e., myelinated cortex, demyelinated cortex, periplaque WM, lesion edge, and lesion core) from relatively young progressive MS cases (n = 30) and non-neurological controls (n = 13). Created in BioRender. Absinta, M. (2025) https://BioRender.com/d0hxq2g. b Representative image of punch-based sampling of CAL edge, periplaque NAWM, and myelinated cortex (see Supplementary Data 1 for a detailed description of each sample and identification number). c Number of tissue samples for each location (control cortex, MS myelinated and demyelinated cortex, control WM) and pathological stages. d Representative multiplex immunostaining showing the pathological staging of MS tissue based on myelination status, presence of neurons, and characterization of the myeloid infiltrate (TMEM119+ for surveilling microglia and MHCII+ for activated antigen-presenting microglia). Dotted lines correspond to the lesion edge in CA and CI lesions. Scale bar 50 μm. e snRNA-seq clustering of 197,912 nuclei by cell type, labelled based on known lineage markers, and visualized as UMAP plot. Each dot corresponds to a single nucleus and each colour to a cell-type cluster. f Dot plot depicting selected differentially expressed genes for each cluster and associated cluster labelling. Dot size corresponds to the percentage of nuclei expressing the gene in each cluster, and the colour represents the average expression level. g Averaged percentage of cell populations in the different microenvironments. snRNA-seq single-nucleus RNA sequencing, WM white matter, NAWM normal appearing white matter, MS multiple sclerosis, CA chronic active, CAL chronic active lesion, UMAP uniform manifold approximation and projection, CI chronic inactive, VAS vascular cells, OPC oligoprecursor cells, AST astrocytes, LYM lymphocytes, OLIGO oligodendrocytes, NEU neurons.
Fig. 2
Fig. 2. Cellular senescence-associated transcriptional signatures predominate in the white matter endothelia, microglia, and astrocytes.
a Schematic representation of the consensus-based strategy used for senescent cell identification. Cell cycle arrest was evaluated by scoring cell cycle-related gene signatures using the senescence index tool (SIT), followed by protein validation of p16INK4a levels in MS tissues. Cell cycle arrest and SASP were assessed by scoring SenMayo gene signature. DNA damage response and nuclear reorganization were validated by identifying TBP53 and nuclear lamin B1 protein levels in MS tissues. Created in BioRender. Absinta, M. (2025) https://BioRender.com/d0hxq2g. b UMAP showing mapping SenMayo gene signature scores in the cortex and white matter from MS cases vs. controls. c Quantification (%, mean ± SEM) of SenMayo-informed senescent cells by location (white matter and cortex) in MS tissues vs. non-neurological controls (n = 43 biological samples, two-way ANOVA, p = 0.05, post-hoc multiple comparison analysis * p = 0.028). d Random Forest on the percentage of SenMayo-defined senescent cells highlighting the CNS cell type, pathological stage, and subject age as the most relevant factors. e Heatmap showing the percentage of SenMayo-defined senescent cells by CNS cell type and pathological stage (linear mixed model with fixed effects [sex, age, and pathological lesion stage] by each CNS cell type, * p < 0.05, **p < 0.01). f Correlation between SenMayo- and SIT-defined senescent-like cells (Pearson correlation coefficient r = 0.47, p < 0.001, equation y = 0.6278*x + 7.077). g A representative example of the CA lesion edge. Within the CA lesion edge, most cells (both microglia and endothelia) are positive for the senescence marker p16INK4a (arrows). Separate channels are shown to facilitate the visualization of different markers. Dotted lines indicate the lesion edge. h A representative example of the lesion core. Within the lesion core, the arrows indicate astrocytes positive for the senescence marker p16INK4a. i A representative example of p16INK4a+ ependymal cells. j Violin plot showing the quantification of p16INK4a+ cells (%) on human brain tissue by pathological condition from eighteen 5-μm paraffin-embedded tissue sections (ANOVA p < 0.0001; Tukey’s multiple comparisons * p < 0.05; ** p < 0.01; *** p < 0.001; **** p < 0.0001). The violin plot shows the median (black line), quartiles (dotted lines), as well as the minima and maxima. snRNA-seq single-nucleus RNA sequencing, UMAP uniform manifold approximation and projection, MS multiple sclerosis, CA chronic active, CI chronic inactive, NAWM normal appearing white matter, OPC oligoprecursor cells, SASP senescence-associated secretory phenotype.
Fig. 3
Fig. 3. Immune cell subclustering identified subsets of senescent-like cells.
a Immune cell subset based on snRNAseq. b Immune cell subclustering (UMAP plots) and annotation based on Absinta et al. Heatmap displaying gene module scores between subclusters and Absinta et al.. c Percentage of the different immune cell subclustering by location and pathological stage. d Heatmap showing the expression of genes included in the SenMayo signature in microglia by tissue location and pathological stage. e Quantification (%) of SenMayo-defined senescent cells in each immune subclustered population demonstrating the presence of subsets of senescent-like cells in each subcluster. f Representative multiplex immunostaining showing the co-existence of p16INK4a positive and negative IBA1+, MHCII+, and CD68+ microglia at the chronic active lesion edge. g Correlation between the SenMayo signature score and the GO negative regulation of autophagy signature score by cell type (n = 43 samples, Pearson correlation coefficient r = 0.48, p < 0.0001, equation y = 0.3555*x + 0.0747). Each dot in the scatter plot represents the average of the scores per sample, cell type, and signature. h LFB-PAS staining showing lipofuscin-laden microglia cells at the chronic active lesion edge (arrows, magnified views). DC dendritic cells, MG microglia, MIMS microglia inflamed in MS, CAL chronic active lesion, PV M0 perivascular macrophages, WM white matter, CX cortex, LFB-PAS Luxol fast blue-periodic acid Schiff.
Fig. 4
Fig. 4. Vascular and astrocyte cell subclustering identified subsets of senescent-like cells.
a Vascular cell subset based on snRNAseq initial clustering. b UMAP of vascular subclusters and annotation based on Yang et al. Heatmap displaying gene module scores between subclusters and Yang et al.. c Percentage of the vascular cell populations by location and pathological stage. d Quantification (%) of SenMayo-defined senescent-like cells in each vascular subclustered population demonstrating the presence of subsets of senescent cells in each subcluster. e Representative multiplex immunostaining showing the co-existence of p16INK4a+ and p16INK4a− CD31+ vascular cells at the chronic active edge. f UMAP of astrocyte subtypes and annotation by cortex and white matter based on Absinta et al. and Lerma-Martin et al.. g Dot plot of averaged z-transformed gene expression of marker genes for each astrocyte subtype. h Percentage of the astrocyte subclustered populations by location and pathological stage. i Quantification (%) of SenMayo-defined senescent cells in each astrocyte subclusters. j Representative multiplex immunostaining showing the co-existence of p16INK4a+ and p16INK4a− Vimentin+ inflammatory astrocytes at the chronic active lesion edge. Cl cluster, WM white matter, CX cortex, AIMS astrocytes inflamed in MS.
Fig. 5
Fig. 5. Spatial transcriptomics mapping of MS brain tissue.
a Overview of the study design. Multimodal data were imputed in each spot, including gene expression, definition of microenvironments/niches (unsupervised and/or manual clustering), snRNA-seq informed spot’s cell-type deconvolution, and ligand-receptor pair-based cell communication. Created in BioRender. Absinta, M. (2025) https://BioRender.com/d0hxq2g. b Pie chart showing the percentage of spots by anatomo-pathological niches (total number of spots = 45,335; Supplementary Data 4 for a detailed description of each sample and identification number). c Violin plots showing the number of gene counts by niches for each location and pathological stage. d Heatmap showing the deconvoluted cell-type proportion by niches (asterisks identify conditions with more than 15% of total deconvoluted cells). e Representative example of the comprehensive spatial transcriptomic analysis of a CAL (woman with progressive MS in her 40 s). By histology, CAL are demyelinated lesions with an inflammatory edge of MHCII+ myeloid cells. A 6.5-mm2 of tissue (white square) was processed for spatial transcriptomics using the 10× Visium platform. Both manual and unsupervised clustering are shown. The unsupervised clustering identified transcriptional microenvironments (CAL edge, core, WM periplaque, and cortex; red spots) overlaid onto the LFB-stained tissue. These microenvironments are in line with the pathological tissue staging. f Enhanced spatial gene expression of SPP1, CHIT1, FTL, APOE, and C1QB that are the among top differentially expressed genes at the CAL edge. g Spatially-resolved microglia subclustering (red spots) after deconvolution of the snRNAseq dataset from Absinta et al. are overlaid onto the LFB-stained tissue. The previously described MIMS-iron and MIMS-foamy are microglia clusters located at the CAL edge. Stressed microglia are sparsely seen in the CAL core, edge, and periplaque. Homeostatic microglia are rarely located in the periplaque WM only. WM white matter, CAL chronic active lesion, CI chronic inactive lesion, LFB-PAS luxol fast blue-periodic acid-Schiff.
Fig. 6
Fig. 6. Centrifugal propagation of cellular senescent transcriptional signatures by spatial transcriptomics.
a Representative expression of inflammatory (SPP1, C3) and senescence-associated genes (SERPINA3, HMGB1, IGFBP5, and CDKN1A) in different MS pathological tissue (i.e., active lesion, CAL, chronic inactive lesion, remyelinated lesion, and non-lesional MS tissue). b Gradients of senescence-associated astrocyte signature (55 genes) was observed extending from the lesional areas toward the periplaque in Visium slides with CAL and chronic inactive lesions. c, d Spatial differential expression analysis of genes along a linear trajectory identified non-random gene gradients (SPARKX p < 0.01). Error bands of line plots indicate the confidence interval (level 0.95). Cellular senescence-related genes and SenMayo genelist exhibited non-random gradients not only within lesional areas but also in the surrounding periplaque in chronic active lesion slide V01, whereas such pattern was not observed in the active lesion slide V05. e SenMayo genelists spatial gradient for Visium slide, including a remyelinated lesion. Error bands of line plots indicate the confidence interval (level 0.95). Remyelination was assessed by both lipid staining (LFB) and myelin PLP immunostaining. The asterisk indicates the postcapillary central venule. CAL chronic active lesion, MBP myelin basic protein, LFB luxol fast blue, WM white matter, PLP myelin proteolipid protein.
Fig. 7
Fig. 7. Senescent-like microglial cells-driven rewiring of cellular communication in MS tissue.
a Workflow schematic of the cell-cell communication analysis using both snRNAseq and spatial transcriptomic datasets (CellChat, NICHES tools). Created in BioRender. Absinta, M. (2025) https://BioRender.com/d0hxq2g. b Circle plot representing the comparison between the cellular communication (ligand-receptors [LR] pairs) between senescent-like microglia and other cell populations vs. non-senescent microglia and other cell populations using CellChat on snRNAseq data. Red lines indicate increased number of interaction ligand-receptors pairs, while blue line reduced number of interactions. c Chord diagram showing detailed communication through upregulated pathways and providing insights into the autocrine- vs. paracrine-acting pathways for senescent microglia using CellChat. Significant upregulation was defined by an interaction with p < 0.05 and logFC for ligand expression >0.2. Colours correspond to the different cell-types. d Spatially mapping of prioritized ligand-receptor pairs involving senescent-like microglia (SPP1-CD44, TREM2-APOE, HLADB1-CD4, NAMPT-ITGAV5, PSAP-GPR37) within the Visium spot and their relative quantification (mean ± SD) by location and pathological stage (n = 7 locations/pathological stages from 12 Visium slides, ANOVA p < 0.0001 for all pairs, except PSAP-GPR37, post-hoc multiple comparison analysis *p < 0.05; **p < 0.01; ***p < 0.001; ****p < 0.0001). Representative icons with ligand-receptors pairs created in BioRender. Absinta, M. (2025) https://BioRender.com/d0hxq2g.
Fig. 8
Fig. 8. MS-relevant inflammatory stimuli increased the number of senescent-like cells in a hiPSC-derived neural glia-enriched organoid model.
a Immunostaining of NeuN+ and MAP2+ neurons, MBP+ oligodendrocytes, SOX10-eGFP+ OPCs, GFAP+ astrocytes, and MHCII+ microglia out of DAPI in whole cryosections from 8 weeks-old submillimetric glia-enriched organoids (30×). Scale bar: 100 μm. b Trasmission electron microscopy showing myelinated axons (red arrows) within the glia-enriched organoid. Scale bar: 500 nm. c Representative images and quantification of SA-β-galactosidase activity along the organoid differentiation (n = 3 MS hiPSC-lines; at least 25 glia-enriched organoids per condition; one-way ANOVA p < 0.0001, Tukey’s post-hoc multiple comparison analysis * p < 0.05; ** p < 0.01; *** p < 0.001; **** p < 0.0001). The violin plots show the median (red line), quartiles (dotted lines), as well as the minima and maxima; each dot corresponds to one glia-enriched organoid. d Representative images of untreated organoids (left) vs. organoids exposed to 10% CSF (right) for 24 h (top, > 100 glia-enriched organoids analyzed per experimental condition) and 6 days (bottom, > 40 analyzed organoids per experimental condition) and relative quantification of SA-β-gal staining area (n = 3 MS hiPSC-lines, t-test *** p = 0.001; **** p < 0.0001). The violin plots show the median (black line), quartiles (dotted lines), as well as the minima and maxima; each dot corresponds to one glia-enriched organoid. e Single-cell RNA-seq clustering of 118,706 cells, visualized as UMAP plot, from 8-week-old glia-enriched organoids (from 3 MS hiPSC-lines). Each dot corresponds to a single cell and each colour to a cell cluster. f Averaged percentage of each cell population by experimental condition. g Dot plot of averaged z-transformed gene expression of marker genes for each cluster. h Box plot showing the percentage of SIT-defined senescent cells (mean ± SEM; n = 3 MS hiPSC-lines; ANOVA p = 0.028, Kruskal–Wallis post-hoc multiple comparison analysis *p = 0.011). Increased number of senescent-like cells is seen after stimulation with MS CSF or inflammatory cytokines. i Heatmap showing the averaged percentage of SIT-defined senescent cells in the different cell-types by experimental condition (two-way ANOVA p = 0.05, row effect p = 0.012, column effect p = 0.015, post-hoc multiple comparison analysis *p < 0.05). j Volcano plot reports gene expression changes in SIT-defined senescent vs. non-senescent microglia from glia-enriched organoids. W8 week 8, MS multiple sclerosis, SEM standard error of the mean, CSF cerebrospinal fluid, NEU neurons, ASTRO astrocytes, OPC oligodendrocyte precursor cells, OL oligodendrocytes, GLIA_IMM immature glia, PROG cycling progenitors, MG hiPSC-derived microglia, SA-β-gal senescence-associated β-galactosidase activity, MBP myelin basic protein, SIT senescence index tool.
Fig. 9
Fig. 9. Modulation of cellular senescence in a hiPSC-derived neural glia-enriched organoid model.
a Principal component analysis of microglia pseudobulk RNA from scRNAseq glia-enriched organoid data and pathway analysis performed on the top 50 genes of PC1 and PC2, respectively. Each dot corresponds to one microglia sample. Organoids’ microglia samples exposed to MS CSF and inflammatory cytokines are clustering separately from untreated microglia as well as microglia samples exposed to control CSF and human immunoglobulins G. b Graphical representation of the experimental design for drug treatment in organoids exposed to 10% CSF for 6 h and, then, co-treated with 1,5 μm dasatinib, 50 μm ibudilast, 100 μm α-lipoic acid, and 1 μm tolebrutinib for additional 18 h. Created in BioRender. Absinta, M. (2025) https://BioRender.com/kl03zc0. c, d Quantification of SA-β-gal and MBP+ staining area, respectively (n = 3 MS hiPSC-lines; at least 30 glia-enriched organoids analyzed per experimental condition, respectively; mixed-effect analysis with treatment as fixed effect p < 0.0001; Tukey’s post-hoc multiple comparison analysis * p < 0.05; ** p < 0.01; *** p < 0.001; **** p < 0.0001). The violin plots show the median (red line), quartiles (dotted lines), as well as the minima and maxima; each dot corresponds to one glia-enriched organoid. e Graphical abstract summarizing the results from the hiPSC-derived glia-enriched organoid experiments. The X represents conditions that are not inducing or that are reducing cellular senescence-like processes in the model. Created in BioRender. Absinta, M. (2025) https://BioRender.com/kl03zc0. PC principal component, MS multiple sclerosis, CSF cerebrospinal fluid, SA-β-gal senescence-associated β-galactosidase activity, MBP myelin basic protein.
Fig. 10
Fig. 10. Higher brain biological age in chronic active multiple sclerosis by both transcriptome and MRI.
a Graphical representation of the estimation of the brain biological age by transcriptome or MRI. After obtaining a normative time series for each modality, human brain MS samples or MRI scans were staged for biological vs. chronological age. See “Methods” for additional detail. Created in BioRender. Absinta, M. (2025) https://BioRender.com/d0hxq2g. b Representative 3T MRI case of a man in his ‘50 with MS. Several chronic active lesions (box and magnification) can be seen by MRI as T2-FLAIR-positive hyperintense lesions with a paramagnetic rim (PRL) on susceptibility-based MRI sequences. Scale bars: 10 mm. c Bar plot showing the brain age gap (mean ± SD, years) by transcriptome in brain samples from non-neurological controls (n = 21 samples) and MS (n = 44 samples at different pathological stage). Among all conditions, chronic active lesion edge and core showed higher brain biological age (ANOVA Kruskal–Wallis p < 0.0001, Dunn’s multiple comparison ** p < 0.01, **** p < 0.0001). d Bar plot showing the brain age gap (mean ± SD, years) by MRI analysis in non-neurological controls (n = 22), MS-mimics (n = 44), and MS patients (n = 466). Higher brain age gap is seen in MS patients, especially in those with more than 3 chronic active lesions by MRI (PRL, one-way ANOVA p < 0.0001, Tukey’s post-hoc multiple comparisons * p < 0.05, ** p < 0.01, *** p < 0.001, **** p < 0.0001). e Scatter plot of chronological vs. brain age (years), by MRI, for each individual (n = 532). One dot equals one individual. MS patients were classified based on the PRL number and color-coded. Brain-age trajectories confirmed prior data as seen in (c). f Reverse Kaplan–Meier curves of the probability of the disability milestone EDSS of ≥4 for both chronological (top, comparison of survival curves using log-rank Mantel–Cox test p = 0.0028, median survival 63 years-old for PRL 0, 61 years-old for PRL 1–3, 58 years-old for PRL > 4, respectively) and biological MRI-brain age (bottom, comparison of survival curves using log-rank Mantel–Cox test p = 0.5 n.s., median survival 73.3 years-old for PRL 0, 71.5 years-old for PRL 1–3, 73.7 years-old for PRL > 4, respectively). snRNA-seq single-nucleus RNA sequencing, MS multiple sclerosis, NAWM normal appearing white matter, PRL paramagnetic rim lesions, EDSS Expanded Disability Status Scale.

References

    1. Kuhlmann, T. et al. Multiple sclerosis progression: time for a new mechanism-driven framework. Lancet Neurol.22, 78–88 (2023). - PMC - PubMed
    1. Kappos, L. et al. Contribution of relapse-independent progression vs relapse-associated worsening to overall confirmed disability accumulation in typical relapsing multiple sclerosis in a pooled analysis of 2 randomized clinical trials. JAMA Neurol.77, 1132–1140 (2020). - PMC - PubMed
    1. Absinta, M. et al. Persistent 7-tesla phase rim predicts poor outcome in new multiple sclerosis patient lesions. J. Clin. Invest.126, 2597–2609 (2016). - PMC - PubMed
    1. Absinta, M. et al. Association of chronic active multiple sclerosis lesions with disability in vivo. JAMA Neurol.76, 1474–1483 (2019). - PMC - PubMed
    1. Absinta, M., Lassmann, H. & Trapp, B. D. Mechanisms underlying progression in multiple sclerosis. Curr. Opin. Neurol.33, 277–285 (2020). - PMC - PubMed

MeSH terms

Substances

LinkOut - more resources