. 2025 Sep 26;16(1):8470.
doi: 10.1038/s41467-025-63325-1.

High expression of Rex-orf-I and HBZ mRNAs and bronchiectasis in lung of HTLV-1A/C infected macaques

Affiliations

High expression of Rex-orf-I and HBZ mRNAs and bronchiectasis in lung of HTLV-1A/C infected macaques

Sarkis Sarkis et al. Nat Commun. .

Abstract

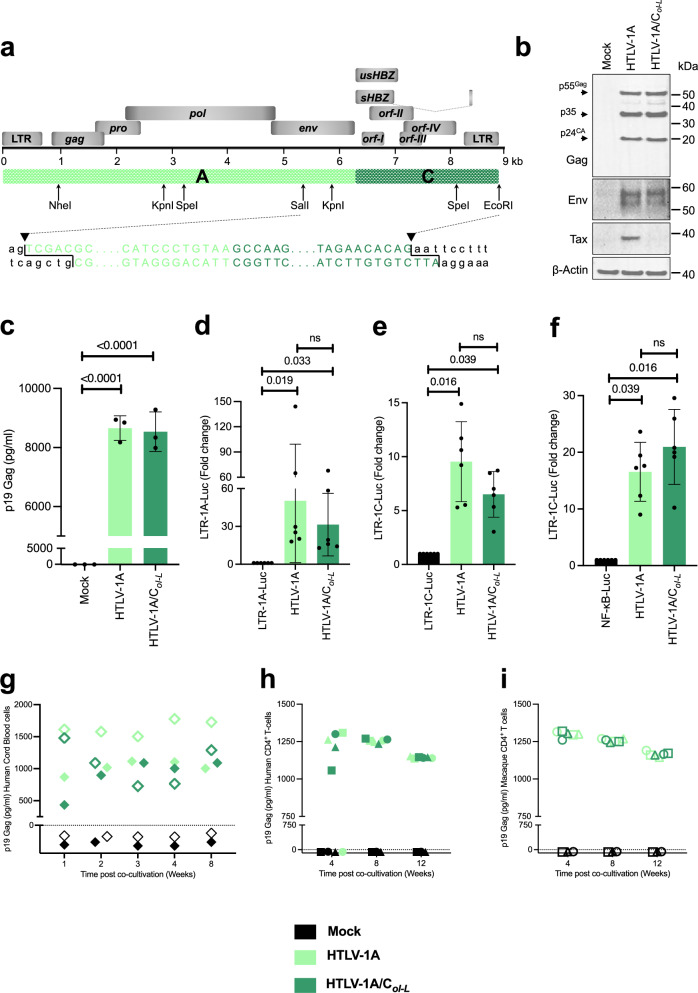
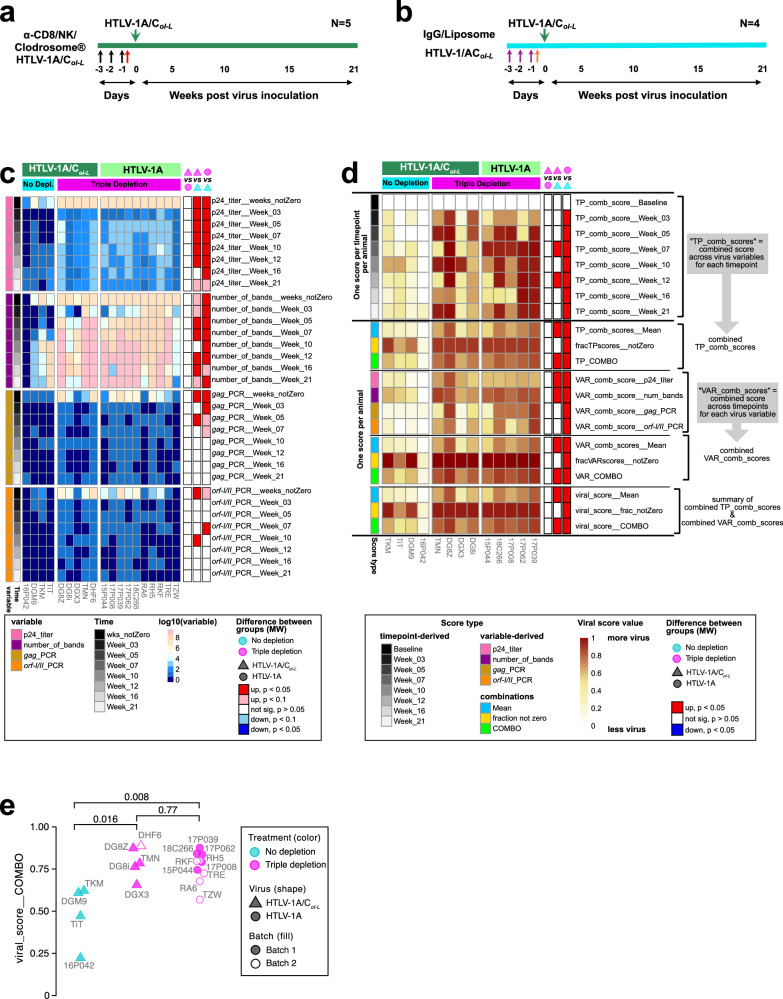
HTLV-1 type-A rarely causes lung disease in humans, whereas HTLV-1 type-C is more frequently associated with respiratory failure and premature death. We investigated the genetic basis of HTLV-1C morbidity by constructing a chimeric HTLV-1A/CoI-L encompassing the highly divergent type C orf-I. We demonstrate that systemic infectivity of HTLV-1A and HTLV-1A/CoI-L is equivalent in macaques, but viral expression in lungs is significantly higher in HTLV-1A/CoI-L infection. In addition, bronchoalveolar-lavage immune cell dynamics differs greatly with neutrophils and monocytes producing TNF-α in HTLV-1A/CoI-L, but producing IL-10 in HTLV-1A infection. Animals infected with HTLV-1A/CoI-L develops bronchiectasis at 10 months from infection, but at the same timepoint those infected with HTLV-1A do not. HTLV-1A/CoI-L expressed a 16 kDa fusion protein (p16C) via a doubly spliced, Rex-orf-IC, mRNA able to shield T-cells from efferocytosis, a monocyte function that mitigates inflammation via clearance of apoptotic cells. The Rex-orf-IC mRNA is expressed as more frequent in the lung of HTLV-1A/CoI-L than HTLV-1A infected animals. Since defective efferocytosis is associated with lung obstructive pathologies, the data raise the hypothesis that p16C may contribute to the lung morbidity observed in HTLV-1C infection.


Conflict of interest statement

Competing interests: The authors declare no competing interests.

Figures

Fig. 1
Fig. 1. HTLV-1A/CoI-L chimeric molecular clone infectivity in humans and macaques in vitro.
a Genome organization of HTLV-1A (top) and schematic representation of HTLV-1A/CoI-L chimeric virus (bottom). Restriction sites used in the construction and verification of the HTLV-1A/CoI-L molecular clone are indicated with an arrow (see Supplementary Fig. 1a). Lowercase letters in black indicate the pAB_HTLV-1A backbone DNA sequence and uppercase letters indicate the inserted DNA fragment cassette including a portion of HTLV-1A envelope (light green) and the entire 3′ end region of the HTLV-1C spanning the orf-I to the 3′ LTR (dark green). b Representative western blot analysis of three independent experiment of Gag, Env, and Tax expression in HEK293T cells transiently transfected with HTLV-1A, HTLV-1A/CoI-L molecular clones, or mock transfected. β-actin was used a loading control. c p19 Gag production in the cultures’ supernatants of the 293 transiently transefected with HTLV-1A, HTLV-1A/CoI-L molecular clones, or mock transfected were assessed by ELISA and presented as pg/ml. Data are mean ± SD from three biological replicates calculated by ordinary one-way ANOVA followed by Dunnet’s multiple comparison test against mock with p = 0.00000073170 and 0.00000079517 for Mock vs. HTLV-1A and Mock vs. HTLV-1A/CoI-L, respectively. Fold change induction of the luciferase activity of d LTR-1A, e LTR-1C, and f NF-κB. Data are mean ± SD from six biological replicates calculated by Kruskal–Wallis test followed by Dunn’s multiple comparison test for group analysis. d ns > 0.999; e, f ns = 0.9645. p19 Gag production used as a surrogate marker for virus infection and virion production was assessed in the supernatant of the g human cord blood cells (n = 2, open and closed diamond shape), h human CD4+ T-cells (n = 3, closed shapes), and i macaque CD4+ T-cells (n = 3, open shapes) cocultured with γ-irradiated 729.6 B-cells producing either HTLV-1A or HTLV-1A/CoI-L viruses. Each symbol represents g an independent human cord blood, h a healthy human donor, or i a juvenile naïve rhesus macaque. ci Black, light green, and dark green correspond to the Mock, HTLV-1A, or HTLV-1A/CoI-L viruses, respectively. Source data are provided as a Source data file.
Fig. 2
Fig. 2. Virus score in triple-depleted animals exposed to HTLV-1A or HTLV-1A/CoI-L.
a, b Schematic of the study design. a Black and b purple arrows correspond to the three consecutive days (Day −3,−2,−1) of treatment with either MT807R1 or IgG control antibodies, respectively, while a red and b orange arrows correspond to the treatments (Day −1) with either Clodrosome® or Liposome control. Dark green arrows in a, b indicate the inoculation day (Day 0) of the lethally γ-irradiated 729.6 B-cell line producing HTLV-1A/CoI-L virus. c Each heatmap block depicts the values for each viral variable (with from top to bottom: p24 titer, number of bands detected on a nitrocellulose strip, gag and orf-I/II detection by PCR) at each timepoint (Weeks 3, 5, 7, 10, 12, 16, and 21) in each treatment (blue and pink)/virus (light and dark green) group, as well as the number of weeks not all zero for the variable as the top of each block. d Heatmap of the composite viral scores for each timepoint, each variable, and combining, accompanying the methods for viral score generation. c, d Significance color bars at right of heatmaps designate whether the Mann–Whitney test (MW), for the pair-wise contrast at top is significantly up (red) /down (blue) or not significant (white) for the variable in each row. e Scatterplot of the 3 treatment/virus groups vs the final COMBO score (bottom line in the heatmap in d, Mann–Whitney p values for pair-wise comparisons among groups are shown. Closed triangles represent non-depleted (blue) or triple-depleted (pink) animals inoculated with HTLV-1A/CoI-L virus from study 1. Closed pink triangle represents the triple-depleted animal (DHF6) inoculated with HTLV-1A/CoI-L virus belonging to study 2. Closed and open pink circles represent triple-depleted animals inoculated with HTLV-1A virus from studies 1 and 2, respectively. Source data are provided as a Source data file.
Fig. 3
Fig. 3. Neutrophil, monocyte, and dendritic cell dynamics in blood and BAL of HTLV-1A and HTLV-1A/CoI-L infected macaques.
Beeswarm boxplots depict cell population frequencies of a plasmacytoid dendritic cells (pDCs) and myeloid dendritic cells (mDCs) and their subsets expressing IL-8, IL-10, or TNF-α markers. b Total monocytes, with the three monocyte populations (CD14+CD16 classical, CL; CD14CD16+ non-classical, NC; and CD14+CD16+ intermediate, IN), and their subsets expressing IL-8, IL-10, both CD162 and IL-10, or TNF-α markers. c Neutrophils and their subsets expressing IL-8, IL-10, both CD162 and IL-10, TNF-α, CD11b, CD64, or MPO markers in blood (left) and BAL (right). The x-axis represents cell frequency. Only cell populations with p < 0.05 by Mann–Whitney test between the two triple-depleted groups at weeks (Wk) 5, 12, or 21 are shown and sorted by timepoint (top to bottom, separated by thick black lines), then by direction of the HTLV-1A/CoI-L vs HTLV-1A difference. P value ranges are indicated by asterisks: *p < 0.05, **p < 0.01, ***p < 0.001. Alluvials connect the same cell populations in the blood and BAL over time. Bulk population and subset frequencies are displayed above and below the dotted line, respectively. For bulk populations, alluvials are colored according to their pattern of significance with consistently HTLV-1A/CoI-L > HTLV-1A (dark green), or HTLV-1A/CoI-L < HTLV-1A (light green) at all significant timepoints/compartments. Purple shading indicates HTLV-1A/CoI-L greater than HTLV-1A, and HTLV-1A/CoI-L less than HTLV-1A at different timepoints/compartments. For subsets, alluvials are colored by marker cytokines as indicated. Alternative visualizations of this data can be found in Supplementary Figs. 6 and 7. While each dark and light green symbol corresponds to an animal from the triple-depleted groups inoculated with HTLV-1A/CoI-L or HTLV-1A, respectively, closed and open symbols correspond to animals belonging either Study 1 or Study 2, respectively. For box and whiskers plots, the center is the median (thick gray bar), bounds of the boxplot are the 25th and 75th percentiles, and whiskers extend from these bounds to the maximum and minimum value no further than 1.5 times the distance between the first and third quartiles. Source data are provided as a Source data file.
Fig. 4
Fig. 4. Distinct cytokine and chemokine profiles in blood and BAL of HTLV-1A/CoI-L and HTLV-1A infected macaques and their correlations with cell populations in blood and BAL.
Heatmaps depict row-scaled pg/mL of cytokines/chemokines that are significantly different (Mann–Whitney, p < 0.05) between HTLV-1A/CoI-L and HTLV-1A at the timepoint indicated in a, b blood and BAL, and c BAL. df Cytokines/chemokines that differed between HTLV-1A/CoI-L and HTLV-1A in ac that significantly correlated (Spearman p < 0.01) with significantly different cell populations at weeks 5, 12, and 21 post viral inoculation. Cytokines/chemokines are organized based on their comparative frequency at the time point and compartment indicated. Cytokines/chemokines higher in HTLV-1A/CoI-L than HTLV-1A (d, e) are indicated by upward, dark green arrows, and those lower in HTLV-1A/CoI-L (f) are shown with downward, light green arrows. In each row, the frequency of cell populations relative to the associated cytokine/chemokine is indicated by orange and purple arrows corresponding to positive (Spearman correlation R > 0) or negative correlations (R < 0), respectively. Pro-inflammatory cell population markers are highlighted in red, while anti-inflammatory cell population markers are highlighted in blue. g Schematic of Spearman associations with p < 0.01 between the cytokines in ac and the cell populations in Fig. 3 at 5 (top), 12 (middle), or 21 (bottom) weeks post viral inoculation. For each time point, significantly associated cytokines or cell populations that are higher in HLTV-1A are on the left (light green column), and those higher in HTLV-1A/CoI-L are on the right (dark green column). Cytokines or cell populations found in the BAL are above with the orange underlay, while those in the blood are below with the yellow underlay. Solid lines connect associated cytokines/cell populations that are in the same compartment, while dashed lines connect cytokine/cell populations in different compartments. Positive associations are designated by arrows on the outer columns of the figure, while negative associations are designated by inhibitory vertical bars in the central region of the figure. Pro-inflammatory cell population markers are highlighted in red, and anti-inflammatory cell population markers are highlighted in blue. Lung scheme was created in BioRender. Sarkis, S. (2025) https://BioRender.com/4uohazj. Source data are provided as a Source data file.
Fig. 5
Fig. 5. Lung Histopathology in HTLV-1A/CoI-L infected animals.
a H&E-stained lung lobe biopsies from three HTLV-1A/CoI-L infected animals (TMN, DG8Z, and TiT). Histopathology images showing peripheral fibrosis (black box, left upper panel) characterized by increased collagenous stroma, expanded alveolar septa (red arrows, left lower panel) in the right cranial lobe of TMN. The middle panels show interstitial pneumonia, characterized by focal thickening of the alveolar septa with increased immune infiltrates in the left cranial lobe of DG8Z (black box, upper middle panel) with lymphocytes and macrophages within alveolar spaces (green arrows, low middle panel) and the rare type 2 pneumocyte hyperplasia (blue arrows, lower middle panel). The right panels depict the pulmonary hemorrhage within the alveolar spaces in the left caudal lobe of TiT (black arrows, lower right panel). Scale bars 2 mm and 100 μm for low (upper panels) and high (lower panels) magnification, respectively. b Representative low and high-magnification gag RNAscope images (upper and lower panels, respectively) from the right cranial lobe of animal TMN (left panels) and the left caudal lobe of TiT (right lobes) stained with HTLV-1 Gag probe (yellow) alongside DAPI (blue) for nuclear counterstain. Low and high-magnification scale bars 300 μm and 20 or 50 μm, respectively. c Images from TMN right cranial lobe showing single-antibody immunohistochemistry for CD20 (B-cell marker), CD3 (T-cell marker), Iba1 (macrophage/monocyte marker), and SMA (activated fibrogenic cell marker). The H&E stain was performed on the same section. Asterisk (*) designates a vessel containing a fibrin thrombus with re-endothelialization. Scale bars 300 μm. Immunohistochemistry and RNAscope assays were used to quantify and characterize immune cells in whole lung sections for 20 slides from 4 groups (5 slides per group, different lung lobes). Source data are provided as a Source data file.
Fig. 6
Fig. 6. Virus score in the lung of triple-depleted animals exposed to HTLV-1A or HTLV-1A/CoI-L.
a Rhesus macaque lung schematic showing the seven lung lobes (right cranial, right middle, right caudal, accessory, left cranial/cranial part, left cranial/caudal part, and left caudal). be Summary of the lung virus variables in addition to the histopathology assay. The bronchiectasis and fibrosis data were converted to binary presence/absence to match all DNA/RNA assays. Heatmaps are shown with animals in columns and variables in rows. In addition to the 7 assays and 2 pathology assays, a total number of positive assays for each lung region (bottom row of each block), and the total number of positive lung regions for each assay (e) were calculated. The statistical analysis was Mann–Whitney, and p value ranges are reported in the rightmost row-annotation column. Rows are sorted first by Assay, then by lobe. The lung schematic was created in BioRender. Sarkis, S. (2025) https://BioRender.com/qzewdz4. Source data are provided as a Source data file.

References

    1. Poiesz, B. J., Ruscetti, F. W., Mier, J. W., Woods, A. M. & Gallo, R. C. T-cell lines established from human T-lymphocytic neoplasias by direct response to T-cell growth factor. Proc. Natl. Acad. Sci. USA77, 6815–6819 (1980). - PMC - PubMed
    1. Kaplan, J. E. et al. The risk of development of HTLV-I-associated myelopathy/tropical spastic paraparesis among persons infected with HTLV-I. J. Acquir Immune Defic. Syndr.3, 1096–1101 (1990). - PubMed
    1. Martin, F., Taylor, G. P. & Jacobson, S. Inflammatory manifestations of HTLV-1 and their therapeutic options. Expert Rev. Clin. Immunol.10, 1531–1546 (2014). - PubMed
    1. Bangham, C. R., Araujo, A., Yamano, Y. & Taylor, G. P. HTLV-1-associated myelopathy/tropical spastic paraparesis. Nat. Rev. Dis. Prim.1, 15012 (2015). - PubMed
    1. Matsuura, E. et al. HTLV-1 associated myelopathy/tropical spastic paraparesis (HAM/TSP): A comparative study to identify factors that influence disease progression. J. Neurol. Sci.371, 112–116 (2016). - PubMed

MeSH terms

Substances

LinkOut - more resources