. 2025 Sep 26;16(1):8485.
doi: 10.1038/s41467-025-63392-4.

A protein-proximity screen reveals Ebola virus co-opts the mRNA decapping complex through the scaffold protein EDC4

Affiliations

A protein-proximity screen reveals Ebola virus co-opts the mRNA decapping complex through the scaffold protein EDC4

Callie J Donahue et al. Nat Commun. .

Abstract

The interaction of host and Ebola virus (EBOV) proteins is required for establishing infection. In this study, we use proximity-dependent biotinylation to identify cellular proteins that bind to EBOV proteins encoded by six of the seven viral genes. Hits are computationally mapped onto a human protein-protein interactome and annotated with viral proteins, confirming known EBOV-host protein interactions and revealing previously undescribed interactions and processes. This approach efficiently arranges proteins into functional complexes associated with single viral proteins. Focused characterization of interactions between EBOV VP35 and the mRNA decapping complex shows that VP35 binds the scaffold protein EDC4 through the C-terminal subdomain, with both proteins colocalizing in EBOV-infected cells. siRNA depletion of EDC4, DCP2, and EDC3 reduces virus replication by inhibiting early viral RNA synthesis. Overall, the analytical approach efficiently identifies EBOV protein interactions with cellular protein complexes, providing a deeper understanding of replication mechanisms for therapeutic intervention.


Conflict of interest statement

Competing interests: The authors declare no competing interests.

Figures
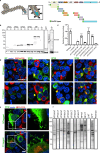
Fig. 1
Fig. 1. A protein proximity screen for Ebola virus proteins identifies an expanded viral interactome.
a Left: Schematic of structural protein arrangement in the virion. Right: EBOV genome denoting virally encoded genes and screening constructs showing BioID2 ligase (green blocks) at the N or C-termini of each protein. b Expression of viral protein-BioID2 fusion constructs and GFP-BioID2 non-specific control in stable cell lines. Blots were probed with biotin ligase-specific antibody, and loading levels were controlled by detection of β-actin. Blots were performed twice with similar results. c Tagged proteins were evaluated for trVLP activity by replacing constructs encoding WT proteins with the tagged protein at the first step to generate trVLPs, and the resulting NanoLuc activity was measured. NanoLuc activity was compared to an RdRp L active site mutant using one-way ANOVA with multiple comparisons correction. Data are presented as mean values from three biological replicates +/- standard deviation (SD). * p = 0.01, *** p < 0.0001. Statistical significance relative to the inactive L mutant sample was determined using ordinary one-way ANOVA with Dunnett’s multiple comparison correction. d N- and C-terminal BioID2 tagged constructs were transfected into HEK293T cells, challenged with EBOV at an MOI of 1, and stained for BioID2 protein (green) and EBOV VP30 as a marker of infection and inclusion bodies (red) at 20 hpi with cell nuclei stained with Hoechst 33342 (blue). Overlap is indicated by yellow. Individual channels for each image are shown in Supplementary Fig. 2a. One technical replicate of one representative biological replicate is shown. Scale bar = 25 μm. e BioID2-tagged VP40 incorporation into filamentous viral particles was evaluated by transfecting cells with each construct, which were then infected and stained as described above. Insets show magnification with BioID2 staining apparent at the plasma membrane, with budding filamentous and torus-shaped structures indicative of virus particles. Scale bar = 10 μm. One technical replicate of one representative biological replicate is shown. f Biotinylation of cellular proteins was measured in cell lysates after inducing expression of each indicated protein by tetracycline and adding biotin to cell medium. GFP-BioID2 and Flp-In TREx 293 cells not expressing any BioID2 construct were used as non-specific biotinylation controls (last two lanes). Blots were probed with fluorescently labeled streptavidin. One representative experimental replicate of each construct is shown. Biotinylation of all four replicates is shown in Supplementary Fig. 2b. Source data are provided as a Source Data File.
Fig. 2
Fig. 2. Network analysis reveals virus interactions with putative host protein complexes.
a Hub-and-spoke network showing 441 high-confidence interactions from the EBOV BioID2 screen. Gray circles represent proteins identified as unique hits using both GFP and other viral proteins as controls. Circles with thicker borders are 64 proteins identified with both N- and C-terminal tagged constructs. b PCSF interrelates BioID hits with the HIPPIE human protein-protein interaction (PPI) network. The algorithm connects hits via shortest pathways defined by the PPI network, considering interaction confidence and the presence of other hits. Hits are shown as green circles, where node size reflects BioID score. Two paths are shown connecting scored hits A and B. The lower path is shorter but less supported by literature citations and requires adding two non-hit proteins (Steiner nodes, triangles). The upper path is longer, includes more screen hits, and has higher-confidence edges with more literature support. The algorithm preferentially includes the upper path in the final solution. c Left Rescoring of hits identified by more than one viral protein. Host proteins were partitioned according to each viral protein’s contribution to the total SAINT score. Right Functional enrichment of subnetworks. Clusters identified by edge-betweenness (red and purple dashed circles), then subjected to gene set enrichment. d Full network generated by PCSF linking BioID2 hits through HIPPIE interactions. Colored circles indicate putative virus-host protein interactions. Lines connecting circles represent human PPIs. Five mRNA decapping complex proteins, each labeled by VP35, are highlighted in the inset. e Network annotated with pathways from Enrichr. Subnetworks are color-coded and numbered. Functional enrichments are in Supplementary Data 8. Source data are provided as a Source Data File.
Fig. 3
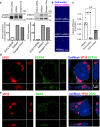
Fig. 3. VP35 interacts with the decapping complex through EDC4.
a Pulldowns of HA-tagged mRNA decapping proteins using anti-HA beads in the presence of FLAG-tagged VP35 show VP35 coprecipitates only with EDC4 (lane 6). One of two biological replicates is shown. b Confirmation of VP35-EDC4 interaction by pulldown of FLAG-tagged VP35 using anti-FLAG beads. One of two biological replicates is shown. c Cells challenged with EBOV at MOI 1 were fixed at 20 hpi, labeled with VP35 and EDC4 antibodies, and imaged by super-resolution confocal microscopy (48 nm resolution in x-y plane). Optical slicing of z-stacks shows x-y axis (top left), x-z and y-z axes (lower and right panels). EDC4 puncta (green) were present throughout the cell and within VP35-positive inclusion bodies (red), with colocalized puncta in yellow. Z-planes spanned 500 nm. Focus planes of x-z and y-z axes are shown with dashed lines. Merged image includes CellMask (blue), EDC4 (green), and VP35 (red). Scale bar = 5 μm. Right Quantification of EDC4 puncta within 21 inclusion bodies of varying volumes. Linear regression yielded R² = 0.78, p = 9.51E-08. One technical replicate of one representative biological replicate is shown. d Cells were infected at MOI 0.5 to visualize both infected and uninfected cells. EDC4 puncta volumes were measured in VP35-positive infected (n = 99) and uninfected (n = 119) cells using Imaris software. Representative merged image and individual channels shown with quantification at right (unpaired t-test, p < 0.0001). e EDC4 levels in EBOV- or mock-infected cells were measured by immunoblot and quantitated relative to β-actin using image densitometry and area under the curve analysis. Values were scaled by 104 to account for low signal intensities. One representative biological replicate containing two technical replicates is shown. f Proximity ligation assay (PLA) with antibodies to EDC4 and VP35. Cells were challenged with EBOV or mock-infected and fixed at 20 hpi. Left shows PLA signal (magenta); right shows PLA merged with CellMask (blue). Scale bar = 25 μm. Quantification shown at right (full images in Supplementary Fig. 4b). One representative biological replicate with four technical replicates is shown. Data are presented as mean ± SD. Statistical significance was determined using an unpaired t-test (p = 0.0131). Source data are provided as a Source Data File.
Fig. 4
Fig. 4. EDC4 levels impact viral RNA production and EBOV growth kinetics.
a EDC4 protein levels after siRNA treatment was measured by immunoblotting with EDC4-specific antibodies. Lower panel shows quantitation of a representative replicate of three independent experiments measured by area under the curve and normalized to β-actin expression levels. b EDC4 was depleted using the indicated siRNA and samples were harvested at 2, 6, 18, 24, 48, and 72 hpi. EBOV was titered by FFU assays performed on VeroE6 cells. Three technical replicates of one biological replicate are shown. Statistical significance was calculated by one-way ANOVA. Data are presented as mean ± SD. P-values = * 0.0271; ** 0.0051. c Viral RNA synthesis was measured by RNAFISH staining using multiple oligonucleotides complementary to EBOV NP and VP35 mRNA. Scale bar = 100 μm. d Quantification of RNAFISH signal from 10 images for which panel c is representative. Two technical replicates of one representative biological replicate are shown. e Measurement of viral RNA species by qPCR. NP and GP mRNA levels were measured after cDNA synthesis using poly-dT primers. Genomic (negative sense) and anti-genomic (positive sense) RNA were measured using a two-step reaction with specific primers (see methods). One representative biological replicate is shown per qPCR, each containing two or three technical replicates as indicated. Source data are provided as a Source Data File.
Fig. 5
Fig. 5. EBOV VP35 interacts with the C-terminal domain of EDC4.
a Schematic of EDC4 showing binding sites for DPC1A and DCP2. In the lower panel, lines indicate constructs used in co-immunoprecipitation and overexpression experiments. b Identification of EDC4 subdomain responsible for VP35 interaction. The indicated HA-tagged EDC4 constructs were co-expressed with FLAG-tagged VP35, and immunoprecipitation was performed with anti-HA antibody. One representative replicate of two biological replicates is shown. c EBOV RNA levels were measured by RNAFISH (magenta) after overexpression of the indicated EDC4 domains. Cell nuclei were stained with Hoechst 33342 (blue). Statistical significance was calculated by one-way ANOVA with multiple comparisons. P-value = * 0.0178; ****P-value < 0.0001. Six technical replicates of one biological replicate are shown. Data are presented as mean ± SD. d Transfection efficiency of EDC4 constructs as determined by HA staining (green). Scale bars = 100 μm. The right panel shows the proportion of cells stained with HA antibody. Six replicates of one biological replicate are shown. Data are presented as mean ± SD. e Cells were challenged with EBOV and fixed 48 hpi, then stained with antibodies against VP35 (grey) to label infected cells, EDC4 (red), and DDX6 (green). Both EDC4 and DDX6 are markers of P-bodies. Cell boundaries are indicated by dashed lines. Scale bar = 25 μm. One technical replicate of a representative biological replicate is shown. Source data are provided as a Source Data File.
Fig. 6
Fig. 6. EBOV replication depends on multiple components of the decapping complex.
a Depletion of DCP2 and EDC3 protein with siRNA. Corresponding bands on each blot (upper panels) were quantitated (lower panels). One of three biological replicates is shown. b Impact of depletion of DCP2 or EDC3 on EBOV infection measured through RNAFISH of viral mRNA. Samples were infected at an MOI of 0.8. Scale bar = 250 μm. c Quantification of b. Statistical analysis was performed using one-way ANOVA with multiple comparisons correction. Four technical replicates of one biological replicate are shown. Data are presented as mean ± SD. *P-value = 0.0111; **P-value = 0.0074; ****P-value < 0.0001. d, e DCP1A and DCP2 colocalize with VP35 during infection. Cells were challenged with EBOV at an MOI of 1, fixed at 20 hpi, stained with the indicated antibodies and imaged. Localization of d DCP1A and e DCP2 puncta in VP35 inclusion bodies was observed. Scale bars = 10 μm. Optical slicing of z-stacks were performed as described in Fig. 3 with the x-y axis at top left and x-z and y-z axes at lower and right panels and the focus of the x-z and y-z planes are indicated by dashed lines. One technical replicate of a representative biological replicate is shown. Source data are provided as a Source Data File.
Fig. 7
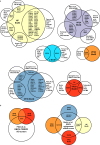
Fig. 7. Comparison of this BioID2 screen with other EBOV PPI and genetic screens.
a BioID hits for indicated virus proteins in this study (colored circles) were compared to other published EBOV PPI screens for those indicated proteins, including mass spectrometry of purified virus particles (Spurgers et al.), affinity-pulldown mass spectrometry using NP, VP35, VP24, VP40 and VP30 as bait proteins to identify interactions (Garcia-Dorival et al.,, Chen et al., Pichlmair et al., Batra et al.), and other BioID screens performed using VP40 or the split TurboID L-VP35 + /-VP30 complex to identify proximal interactors (Fan et al., Fang et al.). No overlap was identified with the NP affinity purification screen performed by Morwitzer et al.. b BioID hits were compared to genetic depletion screens performed for EBOV (Flint et al., Martin et al.). The EBOV entry screen performed by Carette et al. was not included as it involved EBOV GP, which was not included in the present study.

Update of

References

    1. Subissi, L. et al. Ebola virus transmission caused by persistently infected survivors of the 2014–2016 outbreak in West Africa. J. Infect. Dis.218, S287–S291 (2018). - PMC - PubMed
    1. Mulangu, S. et al. A randomized, controlled trial of ebola virus disease therapeutics. N. Engl. J. Med. 381, 2293–2303 (2019). - PMC - PubMed
    1. Hume, A. J. & Mühlberger, E. Distinct genome replication and transcription strategies within the growing filovirus family. J. Mol. Biol.431, 4290–4320 (2019). - PMC - PubMed
    1. Miyake, T. et al. Ebola Virus Inclusion Body Formation and RNA Synthesis Are Controlled by a Novel Domain of Nucleoprotein Interacting with VP35. J. Virol.94, e02100–19 (2020). - PMC - PubMed
    1. Hoenen, T. et al. Inclusion bodies are a site of ebolavirus replication. J. Virol.86, 11779–11788 (2012). - PMC - PubMed

MeSH terms

LinkOut - more resources