. 2025 Sep 26;16(1):8437.
doi: 10.1038/s41467-025-62724-8.

Decoding structural transitions from CdSe nanoclusters to quantum dots through dynamic nuclear polarization NMR

Affiliations

Decoding structural transitions from CdSe nanoclusters to quantum dots through dynamic nuclear polarization NMR

Yunyao Xu et al. Nat Commun. .

Abstract

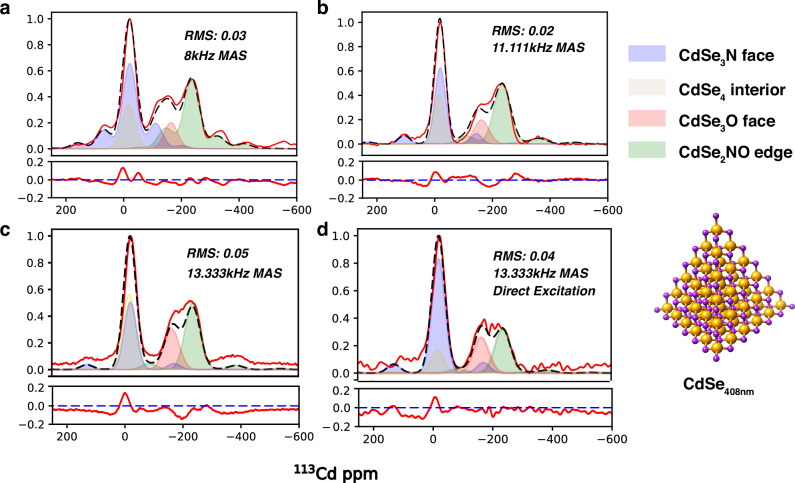
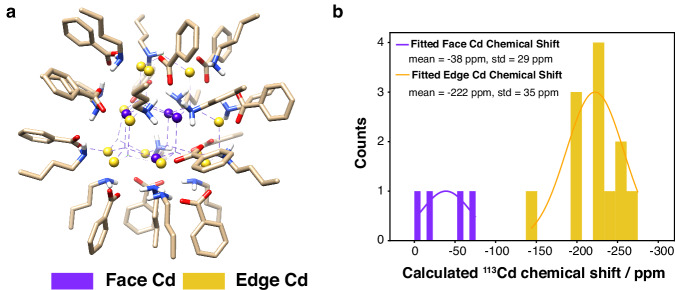
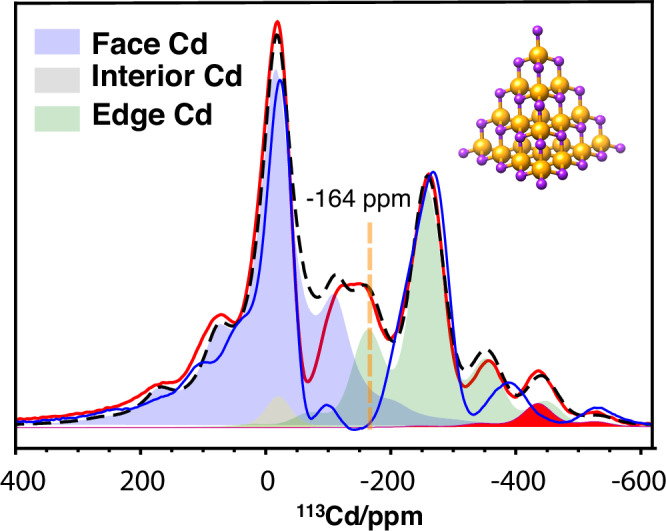
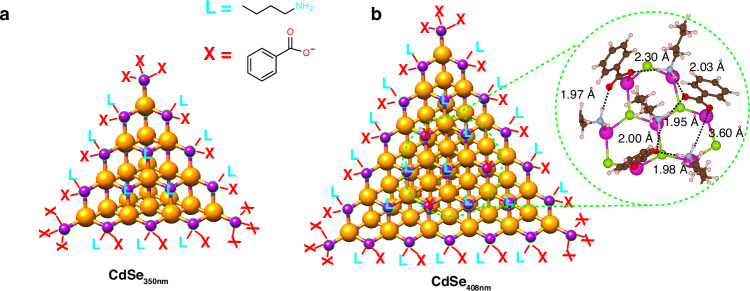
Achieving control over quantum dot size is essential for their performance, but remains challenging due to the limited atomic-level understanding of quantum dot growth. In this study, we employ signal-enhancing Dynamic Nuclear Polarization solid-state NMR to investigate the structural features of intermediate CdSe clusters and mature quantum dots to gain valuable insights. By integrating quantum mechanical calculations with experimental data, we leverage 113Cd chemical shift to elucidate local Cd environments at various positions, decoding the complex ligand distribution on cluster surfaces. Our findings reveal that ligand distribution is stabilizing through inter-ligand hydrogen bonds, while minimizing steric clashes during ligand packing on space-constrained planar facets. This study underscores the unique capability of 113Cd NMR to probe local Cd environments, offering a framework for monitoring structural transitions and improving size control during quantum dot growth.


Conflict of interest statement

Competing interests: The authors declare the following competing interests: R.A.F. is a cofounder and consultant for Schrodinger Inc. The remaining authors declare no competing interests.

Figures

Fig. 1
Fig. 1. A survey of 113Cd chemical shift data in various nanomaterials.
We analyzed several Cd-binding moieties, including those involving chalcogen and nitrogen-based ligands. The new moieties introduced in this study are highlighted with red squares. For example, the CdSe2NO moiety represents a coordination of Cd with two Se atoms, one N atom, and one O atom. Notably, 113Cd chemical shifts are highly indicative of binding environments. Detailed experimental values, including chemical shifts, chemical shift anisotropy, and corresponding literature references, are provided in Supplementary Table 1.
Fig. 2
Fig. 2. Energy profile of CdSe QD growth.
An energy of formation profile is presented along number of atoms per crystal, with structural models of CdSe350nm, CdSe408nm nanoclusters as metastable intermediates, and the 2.8 nm mature QD as the final product.
Fig. 3
Fig. 3. An optimized DNP-NMR sample preparation method for studying CdSe materials.
a The general sample preparation procedure used in this study to prepare DNP-NMR samples. bd Examples of significant signal enhancements on 1H (both 16 scans), 13C (both 16 scans, CP Experiments) and 113Cd (both 4096 scans, CP Experiments) using DNP-NMR, comparing spectra with the microwave source on and off. Source data are provided as a Source Data file.
Fig. 4
Fig. 4. Spectral assignments for core and surface Cd atoms in QD.
a Comparison of Direct Excitation (DE, red) and 1H-113Cd cross-polarization (CP, blue) spectra for the 2.8 nm QD. Peaks corresponding to core Cd, surface Cd, and starting material Cd oleate are labeled as #1, #2, and #3, respectively. Spinning sidebands are indicated with asterisks. b Illustration showing how Cd atoms near ligands exhibit higher CP efficiency in the 1H-113Cd CP experiment. c The spectrum was fitted to extract the chemical shift and chemical shift anisotropy (CSA). Full fitting parameters and results can be found in Supplementary Fig. 2. Source data are provided as a Source Data file.
Fig. 5
Fig. 5. Spectral assignments for distinctive sites in CdSe408nm.
ac1H-113Cd CP spectra recorded at various magic angle spinning (MAS) speeds, along with fitted spectra for four distinct Cd environments. Root-Mean-Square (RMS) values were calculated to quantify the differences between the experimental and fitted spectra. The solid red line represents the experimental spectrum, while the dashed black line corresponds to the synthesized spectrum, combining the fits for various sites. The difference spectrum between the experimental and synthesized spectra is shown as a red solid curve in the lower panel with a dashed blue line as the baseline at 0. d113Cd DE spectra recorded at 13.333 kHz, along with the corresponding fitted spectra. Experimental, synthesized, and difference spectra are displayed in the same format. Details on the fitting procedure are provided in the experimental section, and the fitting results are summarized in Supplementary Table 5. Source data are provided as a Source Data file.
Fig. 6
Fig. 6. DFT calculations-assisted Cd chemical shift assignments.
a The cluster model used for DFT calculations of NMR parameters, where face Cd atoms are shown in purple and are ligated with N-butylamine, while edge Cd atoms are shown in yellow and are ligated with both N-butylamine and benzoate. Se atoms are omitted for clarity. b DFT calculation results for ¹¹³Cd chemical shifts of the face (purple) and edge Cd (yellow) atoms, fitted to Gaussian distributions with corresponding mean and standard deviation. Source data are provided as a Source Data file.
Fig. 7
Fig. 7. Spectral assignments for distinctive sites in CdSe350nm.
1H-113Cd CP spectra of CdSe350nm at 8.4 kHz (red solid line) and 11 kHz (blue solid line). The 8.4 kHz spectrum is fitted with four distinct Cd environments, represented as blue (face Cd), gray (interior Cd), green (edge Cd), and red (potential vertex Cd). The overall fit is shown by the black dashed line. The line at −164 ppm emphasizes the absence or minimal presence of a peak at this position in the 11 kHz spectrum, in contrast to CdSe408nm. Detailed fitting results are provided in Supplementary Table 7. Source data are provided as a Source Data file.
Fig. 8
Fig. 8. Ligand distribution models.
Proposed ligand distribution models for CdSe350nm (a) and CdSe408nm (b) based on NMR-derived restraints, are shown. A close-up view highlights the potential hydrogen bond (HB), with the corresponding distance between H and O atoms labeled, between X (benzoate) and L (N-butylamine) on the surface of the CdSe408nm cluster.

References

    1. Kovalenko, M. V. et al. Prospects of nanoscience with nanocrystals. ACS Nano9, 1012–1057 (2015). - PubMed
    1. Steigerwald, M. L. & Brus, L. E. Semiconductor crystallites: a class of large molecules. Acc. Chem. Res.23, 183–188 (1990).
    1. Owen, J. S., Chan, E. M., Liu, H. & Alivisatos, A. P. Precursor conversion kinetics and the nucleation of cadmium selenide nanocrystals. J. Am. Chem. Soc.132, 18206–18213 (2010). - PubMed
    1. Dai, X., Deng, Y., Peng, X. & Jin, Y. Quantum-dot light-emitting diodes for large-area displays: towards the dawn of commercialization. Adv. Mater. 29, 1607022 (2017). - PubMed
    1. Nomura, M. & Arakawa, Y. Light sources: Shaking quantum dots. Nat. Photonics6, 9–10 (2012).

LinkOut - more resources