. 2025 Sep 26;16(1):8449.
doi: 10.1038/s41467-025-63038-5.

A single residue in the yellow fever virus envelope protein modulates virion architecture and antigenicity

Affiliations

A single residue in the yellow fever virus envelope protein modulates virion architecture and antigenicity

Summa Bibby et al. Nat Commun. .

Abstract

Yellow fever virus (YFV) is a re-emerging flavivirus that causes severe hepatic disease and mortality in humans. Despite being researched for over a century, the structure of YFV has remained elusive. Here we use a chimeric virus platform to resolve the first high resolution cryo-EM structures of YFV. Stark differences in particle morphology and homogeneity are observed between vaccine and virulent strains of YFV, and these are found to have significant implications on antibody recognition and neutralisation. We identify a single residue (R380) in the YFV17D envelope protein that stabilises the virion surface, and leads to reduced exposure of the cross-reactive fusion loop epitope. The differences in virion morphology between YFV strains also contribute to the reduced sensitivity of the virulent YFV virions to vaccine-induced antibodies. These findings have significant implications for YFV biology, vaccinology and structure-based flavivirus antigen design.


Conflict of interest statement

Competing interests: N.D.N., R.A.H., J.H.-P. and D.W. are inventors on patent application WO/2018/176075, relating to the chimeric BinJV platform. The remaining authors declare no competing interests.

Figures

Fig. 1
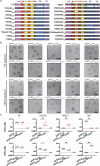
Fig. 1. Structural and antigenic characterisation of bYFVs.
a Representative cryo-EM micrographs of purified bYFV17D, bYFVES504 and bYFVAsibi particles incubated at 4 °C prior to freezing. b Two-dimensional class averages of bYFV17D and bYFVES504 particles. The displayed class distribution is shown as a percentage of the total number of particles. Cryo-EM density map of bYFV17D (c) and bYFVES504 (d) with I3 symmetry applied. The maps are radially coloured according to the following: 0-150 Å red, 151-195 Å yellow, 196-210 Å green, 211-225 Å cyan, 226-240 Å blue Å. e IC50 values of recombinant hIgG1 anti-YFV or anti-flavivirus mAbs against bYFV17D, bYFVES504 and bYFVAsibi. Each symbol represents a technical replicate from three biological replicates (n = 6). f Serum neutralising titres of human YFV17D vaccinees (n = 14) against bYFV17D, bYFVES504 and bYFVAsibi. In both (e) and (f), neutralisation was determined via FRNTs on C6/36 (Aedes albopictus) cells. Lines indicate group medians. Significance was determined via Kruskal-Wallis tests with Dunn’s multiple comparisons test on GraphPad Prism 9.0. ****p < 0.0001, ***p ≤ 0.0002, **p ≤ 0.002, *p ≤ 0.03. For 2C9: p = 0.006 (ES504 vs. Asibi), 2A10G6: p = 0.040 (17D vs. ES504) and p = 0.002 (17D vs. Asibi), 6B6C−1: p = 0.034 (17D vs. ES504) and p = 0.002 (17D vs. Asibi), 864: p = 0.0015 (17D vs. ES504 and 17D vs. Asibi), human vaccinee sera: p = 0.0001 (17D vs ES504) and p = 0.046 (17D vs Asibi). LOD = limit of detection. Source data is provided as a Source Data file.
Fig. 2
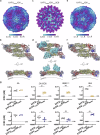
Fig. 2. Cryo-EM of bYFV17D and bYFVES504 complexed with 5A and 2C9 Fabs.
a Representative micrographs of bYFV17D and bYFVES504 with and without complexing with 5A or 2C9 Fab. Viruses and Fabs were combined in a 1:1 ratio and incubated overnight at 4 °C prior to vitrification. b Cryo-EM density maps of bYFV17D and bYFVES504 complexed with either 5A Fab or 2C9 Fab with I3 symmetry applied. Maps are radially coloured according to the following: 0-150 Å red, 151-195 Å yellow, 196-210 Å green, 211-225 Å cyan, 226-240 Å blue Å, 241-255 Å orchid. c Cryo-EM density map and atomic model of bYFV17D complexed with 2C9 Fab. The density map was obtained via symmetry expanded ASU reconstruction and is shown in grey (E) and blue (variable region of 2C9 Fab), with the atomic model shown in red (E-DI), yellow (E-DII), blue (E-DIII) and grey (2C9 Fab). The N151 glycan is shown in green. d Top view of bYFV17D:2C9 E dimer atomic model. e Comparison of the bYFV17D:2C9 cryo-EM near-atomic resolution model and the YFV17D X-ray crystal structure (PDB:6IW4) in pink. Dotted lines are illustrating the E protein curvature differences between these two models.
Fig. 3
Fig. 3. Structural and antigenic characterisation of bYFV prME chimeras.
a Schematic of the prM and E genes of the bYFV17D/ES504 prME chimeras. b Representative micrographs of purified bYFV17D/ES504 prME chimera particles at 4 °C. c IC50 values of recombinant hIgG1 anti-YFV or anti-flavivirus mAbs against the bYFV DIII chimeras. Neutralisation was determined via FRNTs on C6/36 (Aedes albopictus) cells. Each symbol represents a technical replicate from three biological replicates (n = 6) and lines indicate group medians. Parental bYFV17D and bYFVES504 controls are from Fig. 1E. The bYFV DIII chimeras were compared with parental viruses by two-tailed Mann-Whitney tests on GraphPad Prism 9. **p ≤ 0.002, *p ≤ 0.03. For 2A10G6: p = 0.002 (17D vs. 17D/DIIIES504) and p = 0.015 (ES504 vs. ES504/DIII17D), 6B6C−1: p = 0.002 (17D vs. 17D/DIIIES504) and p = 0.009 (ES504/DIII17D), 864: p = 0.002 (17D vs. 17D/DIIIES504) and p = 0.002 (ES504 vs. ES504/DIII17D). Source data is provided as a Source Data file. LOD limit of detection.
Fig. 4
Fig. 4. Cryo-EM of bYFVES504/DIII17D and bYFVAsibi/DIII17D.
a Cryo-EM density map of bYFVES504/DIII17D with I3 symmetry applied and coloured according to its local resolution. b Cryo-EM reconstruction and atomic model of the bYFVES504/DIII17D ASU. c Cryo-EM density map of bYFVES504/DIII17D:2C9 with I3 symmetry applied and coloured according to its local resolution. d Cryo-EM reconstruction and atomic model of bYFVES504/DIII17D:2C9 ASU. e Cryo-EM density map of bYFVAsibi/DIII17D with I3 symmetry applied and coloured according to its local resolution. f Cryo-EM reconstruction and atomic model of bYFVAsibi/DIII17D ASU. In (e) and (f) the pentagons, triangles, and ovals represent the icosahedral five-, three- and two-fold axes, respectively. In (b), (d), and (f) the density map was obtained via symmetry expanded ASU reconstruction using cisTEM2 and is shown in either grey (E) or blue (2C9 Fab), with the atomic models shown in red (E-DI), yellow (E-DII), blue (E-DIII) and grey (2C9 Fab). g IC50 values of recombinant hIgG1 anti-YFV or anti-flavivirus mAbs against the bYFV DIII chimeras. Neutralisation was determined via FRNTs on C6/36 (Aedes albopictus) cells. Lines indicate group medians, and each symbol represents a technical replicate from three biological replicates. For bYFV17D/DIIIAsibi and bYFVAsibi/DIII17D against 5A n = 3, and for all other groups n = 6. Parental bYFV17D and bYFVAsibi controls are from Fig. 1E. bYFV DIII chimeras were compared to parental viruses by two-tailed Mann-Whitney tests on GraphPad Prism 9. **p ≤ 0.002. For 2A10G6: p = 0.002 (17D vs 17D/DIIIAsibi) and p = 0.004 (Asibi vs Asibi/DIII17D), 6B6C−1 and 864: p = 0.002 (17D vs 17D/DIIIAsibi and Asibi vs. Asibi/DIII17D). LOD = limit of detection. Source data is provided as a Source Data file.
Fig. 5
Fig. 5. Structural and antigenic characterisation of bYFV DIII mutant chimeras.
a Schematic of the YFV genome illustrating the four amino acids in DIII where YFV17D differs to both YFVES504 and YFVAsibi. b Representative micrographs of the bYFV DIII mutant chimeras at 4 °C. c IC50 values of recombinant hIgG1 anti-YFV or anti-flavivirus mAbs against the bYFV DIII mutant chimeras. Neutralisation was determined using FRNTs on C6/36 (Aedes albopictus) cells. Each symbol represents a technical replicate from three biological replicates (n = 6) and lines indicate group medians. Parental bYFV17D and bYFVES504 controls are from Fig. 1E. Significance was determined via Kruskal-Wallis tests with Dunn’s multiple comparisons test on GraphPad Prism 9.0. ***p ≤ 0.0002, **p ≤ 0.002, *p ≤ 0.03. For 5A: p = 0.035 (17D F305S vs. 17D R380T), 2A10G6: p = 0.002 (all 17D viruses vs. 17D R380T), p = 0.004 (ES504 M299I vs. ES504 T380R), p = 0.016 (ES504 S305F vs. ES504 T380R), p = 0.01 (ES504 P325S vs. ES504 T380R), 6B6C−1: p = 0.0004 (17D, 17D I299M and 17D F305S vs 17D T380R), p = 0.003 (17D S325P vs 17D R380T), p = 0.002 (ES504 M299I vs. ES504 T380R), p = 0.005 (ES504 S305F vs. ES504 T380R), p = 0.040 (ES504 P325S vs. ES504 T380R), 864: p = 0.029 (17D vs. 17D F305S), p = 0.002 (17D vs. 17D S325P), p = 0.01 (17D I299M vs. 17D F305S), p = 0.0005 (17D I299M vs. 17D S325P). Source data is provided as a Source Data file. LOD limit of detection.
Fig. 6
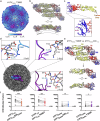
Fig. 6. Characterisation of bYFVES504 T380R.
a Cryo-EM reconstruction of bYFVES504 T380R with I3 symmetry applied and coloured according to its local resolution. b Cryo-EM reconstruction and atomic model of bYFVES504 T380R ASU. The density map was obtained by symmetry expanded ASU reconstruction using cisTEM2 and is shown in grey, with the atomic model shown in red (E-DI), yellow (E-DII) and blue (E-DIII). In (a) and (b) the pentagons, triangles, and ovals represent the icosahedral five-, three- and two-fold axes, respectively. c Atomic model of bYFVES504 T380R E monomer with R380 highlighted in dark pink and the fusion loop highlighted in orange. d Contacts between the five-fold (blue), three-fold (dark purple) and two-fold (light purple) axes E protein R380 residues and the adjacent E proteins. Bonds are depicted by blue dotted lines. e Comparison of the bYFVES504 T380R and bYFVES504/DIII17D (in grey) ASU atomic models, aligned at the five-fold axis E protein. Below is a comparison of the three-fold axis E protein. f Serum neutralising titres of human YFV17D vaccinees (n = 14) against the bYFV DIII chimeras. Neutralisation was determined using FRNTs on C6/36 (Aedes albopictus) cells. Significance was determined using two-tailed Wilcoxon matched-pairs signed rank test on GraphPad Prism 9.0. ***p ≤ 0.0002, **p ≤ 0.002, *p ≤ 0.03. p = 0.0001 (17D vs 17D/DIIIES504), p = 0.0004 (17D vs. 17D R380T), p = 0.009 (ES504 vs. ES504/DIII17D), p = 0.017 (ES504 vs. ES504 T380R). LOD = limit of detection. Source data is provided as a Source Data file. LOD limit of detection.

References

    1. Monath, T. P. & Vasconcelos, P. F. C. Yellow fever. J. Clin. Virol.64, 160–173 (2015). - PubMed
    1. Johansson, M. A., Vasconcelos, P. F. & Staples, J. E. The whole iceberg: estimating the incidence of yellow fever virus infection from the number of severe cases. Trans. R. Soc. Trop. Med. Hyg.108, 482–487 (2014). - PMC - PubMed
    1. Garske, T. et al. Yellow fever in Africa: estimating the burden of disease and impact of mass vaccination from outbreak and serological data. PLoS Med.11, e1001638 (2014). - PMC - PubMed
    1. Douam, F. & Ploss, A. Yellow fever virus: knowledge gaps impeding the fight against an old foe. Trends Microbiol.26, 913–928 (2018). - PMC - PubMed
    1. Hill, S. C. et al. Genomic surveillance of yellow fever virus epizootic in São Paulo, Brazil, 2016 – 2018. PLoS Pathog.16, e1008699 (2020). - PMC - PubMed

MeSH terms

LinkOut - more resources