Comparative Study
. 2025 Sep 26;16(1):8499.
doi: 10.1038/s41467-025-63414-1.

Comparison of imaging based single-cell resolution spatial transcriptomics profiling platforms using formalin-fixed paraffin-embedded tumor samples

Collaborators, Affiliations
Comparative Study

Comparison of imaging based single-cell resolution spatial transcriptomics profiling platforms using formalin-fixed paraffin-embedded tumor samples

Nejla Ozirmak Lermi et al. Nat Commun. .

Abstract

Imaging-based spatial transcriptomics (ST) is evolving as a pivotal technology in studying tumor biology and associated microenvironments. However, the strengths of the commercially available ST platforms in studying spatial biology have not been systematically evaluated using rigorously controlled experiments. We use serial 5 μm sections of formalin-fixed, paraffin-embedded surgically resected lung adenocarcinoma and pleural mesothelioma samples in tissue microarrays to compare the performance of the ST platforms (CosMx, MERFISH, and Xenium (uni/multi-modal)) in reference to bulk RNA sequencing, multiplex immunofluorescence, GeoMx, and hematoxylin and eosin staining data. In addition to an objective assessment of automatic cell segmentation and phenotyping, we perform a manual phenotyping evaluation to assess pathologically meaningful comparisons between ST platforms. Here, we show the intricate differences between the ST platforms, reveal the importance of parameters such as probe design in determining the data quality, and suggest reliable workflows for accurate spatial profiling and molecular discovery.


Conflict of interest statement

Competing interests: C.H. declares research funding to institution from Sanofi, BTG, Iovance, Obsidian, KSQ, EMD Serono, Takeda, Genentech, BMS, Summit Therapeutics, Artidis, Immunogenesis and Novartis; scientific advisory board member of Briacell with stock options; personal fees from Regeneron outside the scope of the submitted work. L.M.S.S. declares research funding to institution from Theolytics, advisory role/consulting fees from BioNTech, travel support for participation in 10x Genomic Pathology Day event and participation in NanoString Roadshow event, both unrelated to this work. M.A. declares research funding to institution from Genentech, Nektar Therapeutics, Merck, GlaxoSmithKline, Novartis, Jounce Therapeutics, Bristol Myers Squibb, Eli Lilly, Adaptimmune, Shattuck Lab, Gilead, Verismo therapeutics, Lyell; scientific advisory board member of GlaxoSmithKline, Shattuck Lab, Bristol Myers Squibb, AstraZeneca, Insightec, Regeneron, Genprex; personal fees from AstraZeneca, Nektar Therapeutics, SITC; participation of safety review committee for Nanobiotix-MDA Alliance, Henlius outside the scope of the submitted work. J.Z. declares research funding from Johnson and Johnson, Helius, Merck, Novartis and Summit, honoraria and consulting fees from AstraZeneca, BeiGene, Catalyst, GenePlus, Helius, Innovent, Johnson and Johnson, Novartis, Takeda and Varian outside the submitted work. D.G. has served on scientific advisory committees for Sanofi, Menarini Ricerche, Onconova, and Eli Lilly, and has received research support from Takeda, NGM Biopharmaceuticals, Boehringer Ingelheim and AstraZeneca. T.C. has received over the past 24 months speaker fees/honoraria (including travel/meeting expenses) from ASCO Post, AstraZeneca, Bio Ascend, Bristol Myers Squibb, Clinical Care Options, IDEOlogy Health, Medical Educator Consortium, Medscape, OncLive, PEAK Medicals, PeerView, Physicians’ Education Resource, Targeted Oncology; advisory role/consulting fees (including travel/meeting expenses) from AstraZeneca, Bristol Myers Squibb, Genentech, Merck, oNKo-innate, Pfizer, and RAPT Therapeutics; institutional research funding from AstraZeneca and Bristol Myers Squibb. All other authors declare no competing interests.

Figures
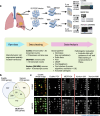
Fig. 1
Fig. 1. Experimental design, panel comparison, and nuclear staining with the ST platforms.
a TMAs containing tissue samples from patients with pleural mesothelioma (MESO1, MESO2; n = 22) or non-small cell lung cancer (NSCLC; ICON1, ICON2; n = 22). Tumor samples were sectioned at a thickness of 5 μm and submitted to CosMx, MERFISH, Xenium-UM, and Xenium-MM assays based on tissue availability. Data analyses were performed using Seurat pipeline and evaluation of pathologists with guidance of mIF and H&E staining. b Venn diagram displays shared genes between panels of the ST platforms. c DAPI staining images of ICON2 and MESO2 TMAs and CosMx whole images of the ICON2 and MESO2 TMAs with staining with morphology markers before Field of View (FOV) selection. Red/white squares display selected FOVs of CosMx. The CosMx FOV, MERFISH, Xenium-UM, and Xenium-MM images display nuclear staining of selected FOV regions and whole tissue cores. Only TMAs with data available from all ST platforms were selected for comparisons. Created in BioRender. Ozirmak lermi, N. (2025) https://BioRender.com/y68w242.
Fig. 2
Fig. 2. Technical comparison of the ST platforms.
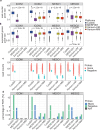
a, b Box plots of the transcript count and uniquely expressed genes per cell that are captured on each ST platform for CosMx (blue) ICON1 (n = 36512), CosMx ICON2 (n = 38395), CosMx MESO1 (n = 58996), CosMx MESO2 (n = 45898), MERFISH (purple) ICON1 (n = 31431), MERFISH ICON2 (n = 94539), MERFISH MESO2 (n = 98149), Xenium-UM (yellow) ICON2 (n = 133019), Xenium-UM MESO1 (n = 142721), Xenium-UM MESO2 (n = 85196), Xenium-MM (orange) ICON2 (n = 113387), Xenium-MM MESO1 (n = 128042), Xenium-MM MESO2 (n = 70472). Data were normalized by panel size. Each dot represents a cell. The center of the box plot is denoted by the median, a horizontal line dividing the box into two equal halves. The bounds of the box are defined by the lower quartile (25th percentile) and the upper quartile (75th percentile). The whiskers extend from the box and represent the data points that fall within 1.5 times the interquartile range (IQR) from the lower and upper quartiles. Any data point outside this range is considered an outlier and plotted individually. The red diamonds correspond to the average transcript counts and uniquely expressed genes in the blocks. Significance assessed using Mann–Whitney–Wilcoxon two-sided test (p < 2.2e−16, p = 0.00039). c Dot plot of the total transcript counts per probe across the ST platforms. Each dot represents a gene probe (red) or a negative control probe (green). d Bar graph of False Discovery Rates (FDR) calculated using negative control or blank probes and total read counts. The y-axis represents FDR as a percentage. The gray bars represent unavailable data. The blue and green bars represent FDR calculated using blank and negative control probes, respectively. Source data are provided as a Source Data file.
Fig. 3
Fig. 3. Comparative analysis of cell segmentation across the ST platforms.
a Zoomed images of nuclear staining (green) overlaid with cell boundaries (white and red) obtained on all platforms using a tissue core of ICON2 TMA (CosMx (n = 14), MERFISH (n = 21), Xenium-UM (n = 26), Xenium-MM (n = 22). Cells with red boundaries represent filtered cells after quality controls. b Bubble plot of the mean cell area sizes (μm²) across the tissue blocks in CosMx (blue), MERFISH (purple), Xenium-UM (yellow) and Xenium-MM (orange) assays. The bubble size corresponds to the difference between the smallest and largest cell areas within each block. c Percentages of the remaining cells after filtering. The dashed lines indicate transcript count thresholds for: Xenium (yellow and orange) (10), MERFISH (purple) (10), and CosMx (blue) (30). Source data are provided as a Source Data file.
Fig. 4
Fig. 4. Concordance of RNA levels between ST platforms and bulk RNA-seq data.
Scatter plots of the average expression of overlapping genes in ST platform and bulk RNA-seq data of patients of the ICON2 (a) and MESO2 (b) TMAs. The red lines represent linear regression of mean log-normalized expression per cell type ± 95% confidence interval. Pearson correlation coefficients (R) are provided in the top left corner of each plot. Outlier genes are annotated. Source data are provided as a Source Data file.
Fig. 5
Fig. 5. Concordance of ST platforms with DSP WTA.
Scatter plots display correlation of the ST platforms and DSP WTA based on shared genes in ICON2 (a) and MESO2 (b) TMAs. The blue lines represent linear regression of mean log-normalized expression per cell type ± 95% confidence interval. The Pearson correlation coefficient (R) is provided in the top left corner of each plot. Source data are provided as a Source Data file.
Fig. 6
Fig. 6. Comparison of gene count detection among the different ST platforms.
Scatter plots display correlation of different ST platforms based on shared genes in ICON2 (a) and MESO2 (b) TMAs. The green lines represent linear regression of mean log-normalized expression per cell type ± 95% confidence interval. The Pearson correlation coefficient (R) is provided in the top left corner of each plot. Source data are provided as a Source Data file.
Fig. 7
Fig. 7. Cell type annotation performance of the ST platforms using the ICON2 TMA.
a UMAP and spatial locations of manually annotated cell type clusters across the platforms. Clusters are labeled with their corresponding cell types based on top-expressed genes. Each color represents a cell type. b Box plots of the F1-scores display performance of cell segmentation and cell type annotations in ST platforms. Each dot represents number of tissue cores in CosMx (blue) ICON2 (n = 14), MERFISH (purple) ICON2 (n = 21), Xenium-MM (orange) ICON2 (n = 21). The center of the box plot is denoted by the median, a horizontal line dividing the box into two equal halves. The bounds of the box are defined by the lower quartile (25th percentile) and the upper quartile (75th percentile). The whiskers extend from the box and represent the data points that fall within 1.5 times the interquartile range (IQR) from the lower and upper quartiles. Any data point outside this range is considered an outlier and plotted individually. Source data are provided as a Source Data file.
Fig. 8
Fig. 8. Cell type annotation performance of the ST platforms in the MESO2 TMA.
UMAP and spatial locations of annotated cell types across the platforms. Each color represents a cell type. The cell type labels were transferred from reference scRNA-seq data of pleural mesothelioma cohorts using Seurat in R.

Update of

References

    1. Marx, V. Method of the Year: spatially resolved transcriptomics. Nat. Methods18, 9–14 (2021). - PubMed
    1. Black, S. et al. CODEX multiplexed tissue imaging with DNA-conjugated antibodies. Nat. Protoc.16, 3802–3835 (2021). - PMC - PubMed
    1. Gröbner, S. N. et al. The landscape of genomic alterations across childhood cancers. Nature555, 321–327 (2018). - PubMed
    1. Chen, K. H., Boettiger, A. N., Moffitt, J. R., Wang, S. & Zhuang, X. RNA imaging. Spatially resolved, highly multiplexed RNA profiling in single cells. Science348, aaa6090 (2015). - PMC - PubMed
    1. Tian, L., Chen, F. & Macosko, E. Z. The expanding vistas of spatial transcriptomics. Nat. Biotechnol.41, 773–782 (2023). - PMC - PubMed

Publication types

LinkOut - more resources