. 2025 Sep 26;16(1):8518.
doi: 10.1038/s41467-025-63500-4.

Gtf2i-encoded transcription factor Tfii-i regulates myelination via Sox10 and Mbp regulatory elements

Affiliations

Gtf2i-encoded transcription factor Tfii-i regulates myelination via Sox10 and Mbp regulatory elements

Gilad Levy et al. Nat Commun. .

Abstract

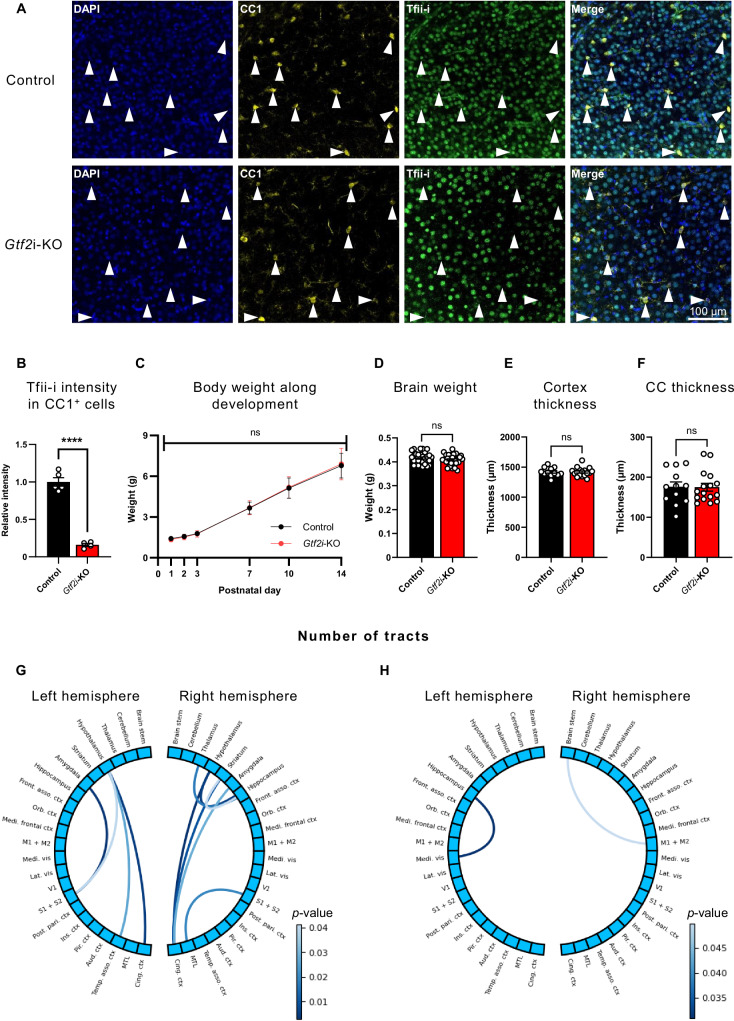
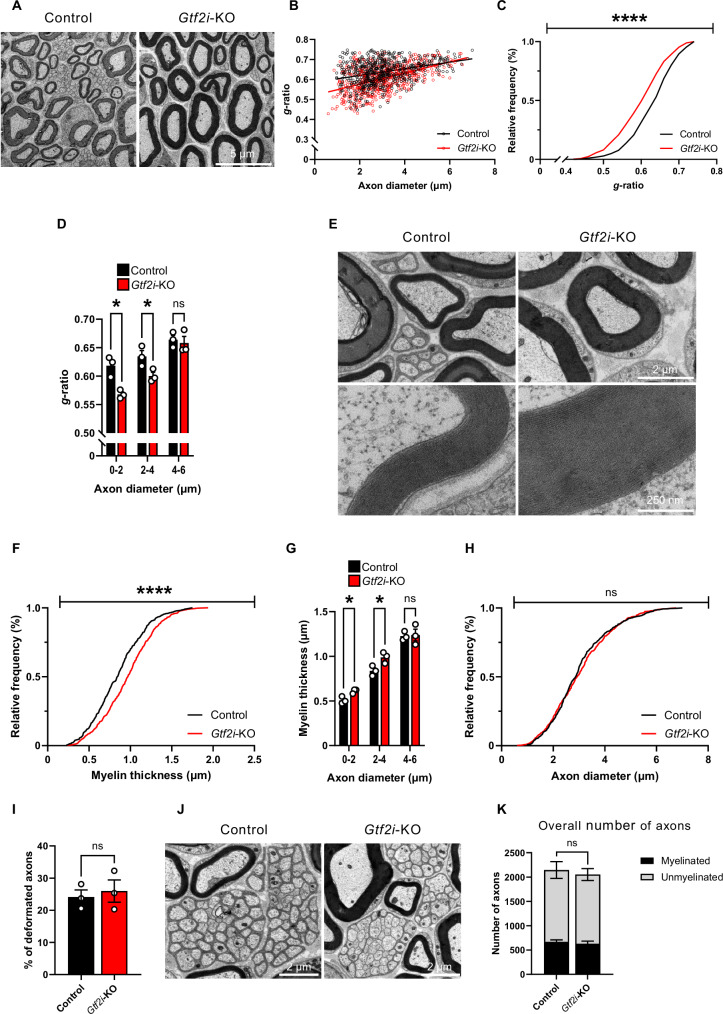
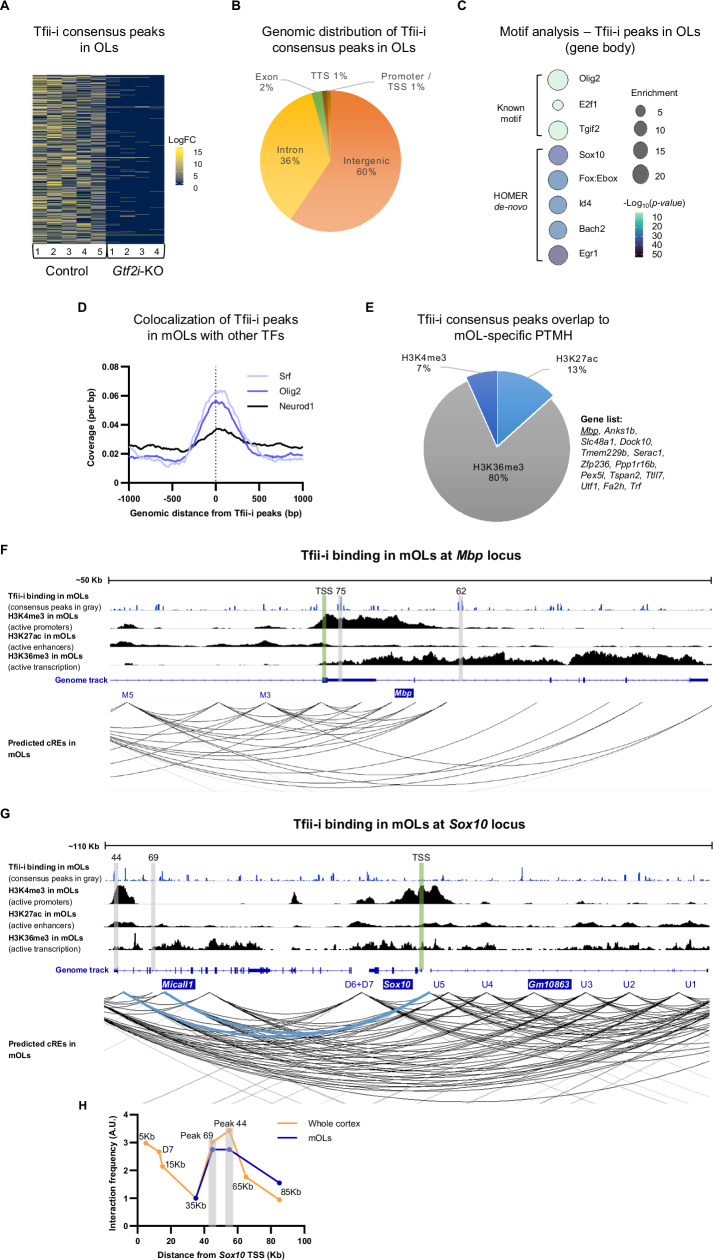
The transcriptional regulatory network governing the differentiation and functionality of oligodendrocytes (OLs) is essential for the formation and maintenance of the myelin sheath, and hence for the proper function of the nervous system. Perturbations in the intricate interplay of transcriptional effectors within this network can lead to a variety of nervous system pathologies. In this study, we identify Gtf2i-encoded general transcription factor II-I (Tfii-i) as a regulator of key myelination-related genes. Gtf2i deletion from myelinating glial cells in male mice leads to functional alterations in central nervous system (CNS) myelin, including elevated mRNA and protein expression levels of myelin basic protein (Mbp), the central myelin component, enhanced connectivity properties, and thicker myelin wrapping axons with increased diameters. These changes resulted in faster axonal conduction across the corpus callosum (CC), and improved motor coordination. Furthermore, we show that in mature OLs (mOLs), Tfii-i directly binds to regulatory elements of Sox10 and Mbp. In the peripheral nervous system (PNS), Gtf2i deletion from Schwann cells (SCs) leads to hypermyelination of the tibial branch of the sciatic nerve (SN). These findings add to our understanding of myelination regulation and specifically elucidate a cell-autonomous mechanism for Tfii-i in myelinating glia transcriptional network.


Conflict of interest statement

Competing interests: The authors declare no competing interests.

Figures

Fig. 1
Fig. 1. Gtf2i deletion from myelinating glia does not alter gross developmental and neuroanatomical properties but results in brain-wide connectivity pattern alterations.
A Representative images of immunofluorescence assay showing intact Tfii-i expression in mOLs (CC1+ cells) of the cortex of control mice (upper row), and a substantial reduction of Tfii-i expression in mOLs of the cortex of Gtf2i-KO mice (lower row). B Tfii-i is significantly decreased in CC1+ cells in the cortex of Gtf2i-KO mice, compared to controls (n = 5 control, n = 4 Gtf2i-KO, 13–20 cells analyzed per mouse, P = 4.24*10−6). Control normalized to 1. CF Unchanged developmental and neuroanatomical properties in Gtf2i-KO mice, compared to controls; C body weight along early postnatal development (control n = 10, Gtf2i-KO n = 12, P = 0.91, two-way ANOVA, Sidak’s multiple comparisons: P > 0.99 for P1, P2, P3, P7, P10, and P = 0.998 for P14), D brain weight at P30 (n = 29 control, n=29 Gtf2i-KO, P = 0.24), E cortex (n = 12 control, n = 17 Gtf2i-KO, P = 0.93) and F CC thickness (n = 12 control, n = 16 Gtf2i-KO, P = 0.96). G, H Connectograms mapping increase in the number of tracts in Gtf2i-KO mice, compared to controls (n = 16 controls, n = 14 Gtf2i-KO). Each arc represents projectiles between two brain regions in which there is a significant increase in the number of tracts in (G) Gtf2i-KO mice compared to littermate controls and in (H) littermate controls compared to Gtf2i-KO mice. B, D-F Two-sided t-test. G, H The scale bar indicates the level of significance (two-sided t-test). Light lines represent significance levels of P < 0.05 and close to this threshold, while dark lines indicate higher levels of significance. Notice the different scale bar values for (G) and (H). BF Data are presented as mean values ± SEM.  **** P < 0.0001, ns – non-significant. Source data are provided as a Source Data file.
Fig. 2
Fig. 2. Altered axonal and myelin properties with enhanced conduction characteristics in the CC of Gtf2i-KO mice.
A Representative TEM images of axons from the CC of control and Gtf2i-KO mice. B Scatter plot of g-ratio values and their respective axon diameters. The dashed line indicates the median diameter of control mice axons (0.53 μm), while the numbers on each side of the line represent the percentage of axons below (left) and above (right) this value for each genotype (two-sided simple linear regression, slopes P = 0.0045). C Myelinated axon diameter distribution demonstrates significantly larger axonal diameters in Gtf2i-KO mice (P = 0.0004). D Myelin thickness of Gtf2i-KO axons is significantly increased, as compared to controls (P = 0.0231). E Myelinated to unmyelinated axons ratio is unchanged in Gtf2i-KO mice, compared to controls (n = 3, P = 0.86). F Representative images of tractography analysis from the entire CC of control and Gtf2i-KO mice. G The CC of Gtf2i-KO mice presents with decreased number of WM tracts, as compared to controls (n = 12 control, n = 14 Gtf2i-KO, P = 0.03). H Representative image of NoR staining at the midline CC. NoRs are marked on the zoomed-in (right) image (white lines). Cells nuclei are stained with DAPI. I The midline CC of Gtf2i-KO mice presents with unchanged NoR length (P = 0.428) and J decreased number of NoRs per FOV, as compared to controls (P = 0.0074). K Illustration of in-vivo EPSP recordings experiment, electrodes placement in the CC and representative traces from recordings of both control and Gtf2i-KO mice. L-N Electrophysiological recordings from the CC (n = 7 control, n = 7 Gtf2i-KO), in-vivo. L Significantly shorter fEPSP latencies across the CC in Gtf2i-KO mice (P = 0.0078), with (M) significantly higher slope (mV/ms) values (P = 0.0497) compared to controls. N Average slope (mV/ms) values are significantly steeper in Gtf2i-KO mice across different stimulus intensities (two-sided mixed-effects analysis, P = 0.042). B–D n = 3 control, 231 axons. n = 3 Gtf2i-KO, 226 axons. I, J n = 4 control, 315 NoRs. n = 4 Gtf2i-KO, 301 NoRs. C, D Two-sided Kolmogorov-Smirnov test. E, G, I, J, L, M Two-sided t-test. E, G, I, J, LN Data are presented as mean values ± SEM. ns—non-significant, * P < 0.05, ** P < 0.01, *** P < 0.001. Source data are provided as a Source Data file.
Fig. 3
Fig. 3. Hypermyelination of the SN of Gtf2i-KO mice.
A Representative TEM images of axons from the SN of control and Gtf2i-KO mice. B Scatter plot of g-ratio values and their respective axon diameters. C Gtf2i-KO mice axons present with significantly lower g-ratio values, compared to controls (P = 1.12*10−10). D Specifically small and medium caliber axons present with lower g-ratio values in Gtf2i-KO mice, as compared to controls (P = 0.01, 0.046, 0.7, for axons with diameters of 0–2 μm, 2–4 μm, and 4–6 μm, respectively). E Gtf2i-KO small caliber axons present increased myelin thickness, representative images. F Myelin thickness of Gtf2i-KO axons is significantly increased, as compared to controls (P = 3.72*10−8). G Small and medium caliber axons specifically present with increased myelin thickness in Gtf2i-KO mice, as compared to controls (P = 0.019, 0.037, 0.863, for axons with diameters of 0–2 μm, 2–4 μm, and 4–6 μm, respectively). H Axonal diameter is unchanged in Gtf2i-KO mice, compared to controls (P = 0.153). I Similar number of myelin abnormalities in the SN of control and Gtf2i-KO mice (P = 0.675). J Representative TEM images of Remak’s bundles from the SN of control and Gtf2i-KO mice. K Unchanged ratio of myelinated, unmyelinated, and overall number of axons in the SN of control and Gtf2i-KO mice (n = 3, P = 0.573, P = 0.819, P = 0.71 for myelinated, unmyelinated, and overall number of axons accordingly). BD, FI n = 3 control, 597 axons. n = 3 Gtf2i-KO, 599 axons. C, F, H Two-sided Kolmogorov-Smirnov test. D, G, I, K Two-sided t-test. Data are presented as mean values ± SEM. ns – non-significant, * P < 0.05, **** P < 0.0001. Source data are provided as a Source Data file.
Fig. 4
Fig. 4. The behavioral phenotype of Gtf2i-KO mice reveals improved motor coordination, increased anxiety-like behavior, and enhanced sociability.
A Rotarod test. Gtf2i-KO mice show improved motor coordination as their latency to the first fall is significantly higher compared to controls along three trials of the rotarod test (n = 19 control, n = 15 Gtf2i-KO, two-sided mixed-effects analysis, P = 0.047). B Open field test. Gtf2i-KO mice show increased anxiety-like behavior as they spend significantly more time in the margins of the arena compared to controls (n = 15 control, n = 14 Gtf2i-KO, two-way ANOVA, P = 0.0325). C EZM test (n = 13 control, n = 17 Gtf2i-KO). Gtf2i-KO mice show a trend towards increased anxiety as they spend less time in the open arms of the EZM compared to controls (P = 0.066). D, E Three-chambers sociability test (n = 14 control, n = 21 Gtf2i-KO). D While both control and Gtf2i-KO mice show preference towards interacting with the social stimulus rather than with the inanimate object (control - P = 0.0001, Gtf2i-KO - P = 1.71*10−10), Gtf2i-KO mice demonstrate increased sociability as their E social index is higher, as compared to controls (P = 0.035). CE Two-sided t-test. AE Data are presented as mean values ± SEM. * P < 0.05, *** P < 0.001, **** P < 0.0001. Source data are provided as a Source Data file. Created with BioRender. Rokach, M. (2025) https://BioRender.com/o51w712.
Fig. 5
Fig. 5. The molecular myelin framework is altered in Gtf2i-KO mice, with increased expression levels of key myelin factors, along different developmental stages.
A Heatmap showing the relative abundance of selected myelin proteins in Gtf2i-KO compared to control myelin derived from the hemisphere of P30 mice. Data represent n = 3 mice per genotype analyzed as four technical replicates per mouse. Note that the relative abundance of several proteins was significantly increased (Mog, Mbp, Padi2) or decreased (Gpr37, Epb41l3, Cfl1) in Gtf2i-KO mice myelin. The abundance of Cnp was reduced in Gtf2i-KO myelin reflecting that the Cre driver line possesses only one Cnp allele. Exact q-values are given in Supplementary Data 1 and were calculated by moderated t-statistics and corrected for multiple comparisons using the Bioconductor R packages ‘limma’ and ‘q-value’, respectively. * q < 0.05, *** q < 0.001 (B) Mbp protein expression level is significantly elevated in the myelin fraction derived from the cortices of Gtf2i-KO mice, as compared to controls (n = 13 control, n = 12 Gtf2i-KO, P = 0.048). C Mbp mRNA expression level in the myelin fraction derived from the cortices of P30 mice is significantly elevated in Gtf2i-KO mice, as compared to controls (n = 11 control, n = 8 Gtf2i-KO, P = 0.0067). DF Quantitative  PCR (qPCR), whole cortex mRNA, P30 mice. D Sox10 (n = 12 control, n = 12 Gtf2i-KO, P = 0.0003) E Mbp (n = 14 control, n = 16 Gtf2i-KO, two-sided Welch’s t-test, P = 0.0006), and F Mog (n = 12 control, n = 13 Gtf2i-KO, P = 0.0071) mRNA expression levels are significantly elevated in Gtf2i-KO mice, compared to controls. G, H Western blot assay on myelin fraction derived from the cortices of P90 mice. G Mbp (n = 12 control, n = 10 Gtf2i-KO, P = 0.0247) and H Mog (n = 12 control, n = 11 Gtf2i-KO, P = 0.008) protein expression levels are significantly elevated in Gtf2i-KO mice, compared to controls. I–K qPCR, whole cortex mRNA, P90 mice. I Sox10 (n = 13 control, n = 14 Gtf2i-KO, P = 0.0269), J Mbp (n = 14 control, n = 15 Gtf2i-KO, P = 0.006), and K Mog (n = 13 control, n = 15 Gtf2i-KO, P = 8.3*10−5) mRNA expression levels are significantly elevated in the cortex of P90 Gtf2i-KO mice, as compared to controls. B–K control normalized to 1. Protein levels were normalized to β-tubulin IV and mRNA levels were normalized to Gapdh. Data are presented as mean values ± SEM. BD, FK Two-sided t-test. * P < 0.05, ** P < 0.01, *** P < 0.001, **** P < 0.0001. Source data are provided as a Source Data file.
Fig. 6
Fig. 6. In-vitro deletion of Tfii-i from mOLs results in increased expression levels of nuclear Sox10, Mbp, and promotes cell growth.
A Illustration of in-vitro experimental design and workflow. Created with BioRender. Rokach, M. (2025) https://BioRender.com/o51w712. B Representative images of Tfii-i (green channel), staining in-vitro following viral infection (mCherry, red channel). Arrowheads point to nuclear localization. C Tfii-i expression level is significantly reduced in differentiated mOL-enriched primary cell culture as a result of viral infection with an iCre-expressing AAV (P = 0.0054). D Representative images of Sox10 (green channel), staining in-vitro following viral infection (mCherry, red channel). Arrowheads point to nuclear localization. E Sox10 expression level is significantly increased in differentiated OPC-enriched primary cell culture as a result of viral infection with an iCre-expressing AAV (P = 0.0187). F Representative images of Mbp (green channel), staining in-vitro following viral infection (mCherry, red channel). G Mbp expression level is significantly increased in differentiated OPC-enriched primary cell culture as a result of viral infection with an iCre-expressing AAV (P = 0.0196). H mOLs cell surface area is significantly increased following Tfii-i deletion in-vitro (two-sided t-test, P = 0.0004). C, E, G, H n = 4 CBAP-mCherry, n = 4 CBAP-iCre-mCherry. Data are presented as mean values ± SEM. C, E, G Two-sided one-sample t-test. * P < 0.05, ** P < 0.01, *** P < 0.001. Source data are provided as a Source Data file.
Fig. 7
Fig. 7. In mOLs, Tfii-i binds RE of Mbp and Sox10.
A Heatmap showing genome-wide Tfii-i binding intensity from ChIP-seq data in mOLs derived from control and Gtf2i-KO mice. B Genomic distribution of Tfii-i consensus peaks in control mOLs. C Motif analysis within a 100 bp window centered on Tfii-i peaks in mOLs reveals enrichment of Olig2 and Sox10 binding motifs. D Colocalization analysis of Tfii-i consensus peaks in mOLs shows high overlap with Srf and Olig2 binding. E Overlap analysis of Tfii-i peaks with mOL-specific PTMH reveals predominant localization within genomic regions enriched for H3K36me3, a mark associated with active transcription. F Tfii-i binding at the Mbp genomic locus. The upper track displays Tfii-i binding in mOLs, with consensus peaks highlighted in gray (peaks 75 and 62), TSS is marked in green. The second, third, and fourth tracks show mOL-specific H3K4me3, H3K27ac, and H3K36me3 binding data, respectively. The genome annotation track indicates known Mbp enhancers M3 and M5. The bottom track presents mOL-specific predicted cREs and their putative interactions with target genes, visualized as arcs. G Tfii-i binding at Sox10 genomic locus. The upper track displays Tfii-i binding in mOLs, with consensus peaks highlighted in gray (peaks 44 and 69), the TSS is marked in green. The second, third, and fourth tracks show mOL-specific H3K4me3, H3K27ac, and H3K36me3 binding data, respectively. The genome track indicates known Sox10 enhancers (U1-U5, D6-D7). The bottom track presents mOL-specific predicted cREs. Tfii-i peaks 44 and 69, located within intronic regions of the Micall1 gene, align with these cREs and are predicted to physically interact with the Sox10 promoter (highlighted in blue). H 3C-qPCR analysis (n = 3/4 for whole cortex and n = 4 pooled into a single sample for mOLs, control only). Elevated interaction frequencies were observed between Sox10 promoter and the regions corresponding to consensus peaks 44 and 69 (highlighted in gray), compared to adjacent regions within the same locus. Interaction frequencies were normalized to those at the Ercc3 region and further normalized to the 35 Kb data point for each dataset. Source data are provided as a Source Data file.
Fig. 8
Fig. 8. Graphical summary.
In mOLs, Tfii-i binds REs of the key myelination genes, Sox10 and Mbp. Conditional deletion of Gtf2i from mOLs alters CNS myelin sheath structure and composition, resulting in enhanced signal conduction and improved motor coordination. Created with BioRender. Rokach, M. (2025) https://BioRender.com/o51w712.

References

    1. Simons, M. & Nave, K. A. Oligodendrocytes: myelination and axonal support. Cold Spring Harb. Perspect. Biol.8, a020479 (2015). - PMC - PubMed
    1. Nave, K.-A. & Werner, H. B. Myelination of the nervous system: mechanisms and functions. Annu. Rev. Cell Dev. Biol.30, 503–533 (2014). - PubMed
    1. Sowell, E. R. et al. Mapping cortical change across the human life span. Nat. Neurosci.6, 309–315 (2003). - PubMed
    1. Jakovcevski, I., et al., Oligodendrocyte development and the onset of myelination in the human fetal brain. Front. Neuroanat.3 (2009). - PMC - PubMed
    1. Kuhn, S. et al. Oligodendrocytes in development, myelin generation and beyond. Cells8, 1424 (2019). - PMC - PubMed

MeSH terms

LinkOut - more resources