. 2025 Sep 17;14(9):1125.
doi: 10.3390/antiox14091125.

Recovery of SIRT3-SOD2 Axis and Mitophagy by Short-Term Calorie Restriction in Old Rat Soleus Skeletal Muscle

Affiliations

Recovery of SIRT3-SOD2 Axis and Mitophagy by Short-Term Calorie Restriction in Old Rat Soleus Skeletal Muscle

Rosa Di Lorenzo et al. Antioxidants (Basel). .

Abstract

Age-related mitochondrial dysfunction is involved in the progressive loss of mass and strength of skeletal muscle with aging. The effects of a short-term calorie restriction (ST-CR) were assessed in the oxidative skeletal soleus muscle (Sol) from 27-month-old rats and compared with those of a CR in combination with resveratrol (RSV) (ST-CR + RSV). PGC-1α and PRXIII proteins showed a marked decrease in both ST-CR and ST-CR + RSV rats. The SIRT3 protein presented a very relevant increase in both ST groups. ST-CR and ST-CR + RSV elicited a marked increase in SOD2 protein amount and activity. ST-CR and ST-CR + RSV led to recovery of the SIRT3-SOD2 axis as a fast/early response. ST-CR and ST-CR + RSV did not affect the MFN2 protein, whereas both treatments induced a relevant increase in DRP1 protein. ST-CR and ST-CR + RSV induced a decrease in Parkin protein, suggestive of rescued mitophagy, leading to the elimination of dysfunctional mitochondria. Such a response likely enhanced the fission-mediated elimination of mitochondria, supported by the marked increase in DRP1. MtDNA copy number and TFAM protein were not changed by any ST treatment. The mtDNA oxidative damage level was strongly increased by both ST treatments. All the effects elicited by ST-CR and ST-CR + RSV were specific to the oxidative type fibers.

Keywords: aging; caloric restriction; mitochondrial biogenesis; mitophagy; rat soleus skeletal muscle; resveratrol.


Conflict of interest statement

The authors declare no conflicts of interest.

Figures
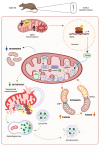
Figure 1
Figure 1
Schematic diagram of relevant mitochondrial pathways in aged rat soleus skeletal muscle. Aged rat soleus skeletal muscle harbors dysfunctional mitochondria deficient in ATP content and presenting an oxidative stress condition featuring abundant ROS, which are neutralized by antioxidant enzymes such as SOD2, induced by SIRT3, and PRXIII. These aged organelles exhibit reduced biogenesis, normally involving PGC-1a and TFAM; decreased PINK1/PARKIN-mediated mitophagy; and unbalanced dynamics, including fission proteins (i.e., DRP1) and fusion proteins (i.e., MFN2). Dashed arrows indicate functional processes. Bold arrows mean decrease or increase of the respective process/molecular species. Abbreviations: I, II, III and IV, mitochondrial respiratory complexes I through IV; ATP, adenosine triphosphate; Cyt C, cytochrome C; DRP1, dynamin-1-like protein; MFN2, mitofusin 2; mtDNA, mitochondrial DNA; nDNA, nuclear DNA; P, phosphate group; PGC-1α, peroxisome proliferator-activated receptor gamma coactivator-1α; PINK1, PTEN-induced kinase 1; PRXIII, peroxiredoxin III; ROS, reactive oxygen species; SIRT3, sirtuin 3; SOD2, manganese superoxide dismutase 2; TFAM, mitochondrial transcription factor A; Ub, ubiquitin. Created in Biorender. Pesce, V. (2025) https://app.biorender.com/illustrations/68af02639d99ad184203a54b?slideId=4d9da8ad-8cd0-40f7-a425-341fbf705dff (accessed on 4 September 2025).
Figure 2
Figure 2
Western blot analysis of PGC-1α (A) and PRXIII (B) proteins in soleus muscle samples from AL, CR, and CR + RSV rats. The quantification of the intensity of the bands of PGC-1α (A) and PRXIII (B), normalized to β-actin intensity, is reported above. At the bottom, the immunobands are indicative of two rats from each of the studied groups. Data shown derive from the results of triplicate Western blot experiments analyzed using the Kruskal–Wallis with Dunn’s post test. Bars indicate the mean values + SEM (n = 6 per group) for the three experimental groups. Data were normalized against the value of the AL rat group, fixed as 1. Statistical significance: * p < 0.05; ** p < 0.01; Dunn’s test. AL: ad libitum; CR: caloric restriction; CR + RSV: caloric restriction and resveratrol (50 mg/kg/day; 6 weeks).
Figure 3
Figure 3
Western blot analysis of SIRT3 (A) and SOD2 (B) proteins and in-gel activity assay for SOD2 activity (C) in soleus muscle samples from AL, CR, and CR + RSV rats. In the histograms (A) and (B), the quantification of the intensity of the bands of SIRT3 (A) and SOD2 (B), normalized to β-actin intensity, is reported. At the bottom, the immunobands are indicative of two rats from each of the studied groups. In the histogram (C), the quantification of the intensity of achromatic areas representative of SOD2 activity normalized to the SOD2 standard is reported. Data shown derive from the results of triplicate Western blot experiments analyzed using the Kruskal–Wallis with Dunn’s post test. Bars indicate the mean values + SEM (n = 6 per group) for the three experimental groups. Data were normalized against the value of the AL rat group, which was fixed as 1. Statistical significance: * p < 0.05; ** p < 0.01 (Dunn’s test). AL: ad libitum; CR: caloric restriction; CR + RSV: caloric restriction and resveratrol (50 mg/kg/day; 6 weeks).
Figure 4
Figure 4
Western blot analysis of MFN2 (A) and DRP1 (B) proteins and fusion index (C) in soleus muscle samples from AL, CR, and CR + RSV rats. The quantification of the intensity of the bands of MFN2 (A) and DRP1 (B), normalized to β-actin intensity, is reported above. At the bottom, the immunobands are indicative of two rats from each of the studied groups. Data shown derive from the results of triplicate Western blot experiments analyzed using the Kruskal–Wallis with Dunn’s post test. Bars indicate the mean values + SEM (n = 6 per group) for the three experimental groups. F.I. (C) indicates the ratio between MFN2 and DRP1. Data were normalized against the value of the AL rat group, fixed as 1. Statistical significance: * p < 0.05, Dunn’s test. AL: ad libitum; CR: caloric restriction; CR + RSV: caloric restriction and resveratrol (50 mg/kg/day; 6 weeks).
Figure 5
Figure 5
Western blot analysis of PINK1 (A) and Parkin (B) proteins in soleus muscle samples from AL, CR, and CR + RSV rats. The quantification of the intensity of the bands of PINK1 (A) and Parkin (B), normalized to β-actin intensity, is reported above. At the bottom, the immunobands are indicative of two rats from each of the studied groups. Data shown derive from the results of triplicate Western blot experiments analyzed using the Kruskal–Wallis with Dunn’s post test. Bars indicate the mean values + SEM (n = 6 per group) for the three experimental groups. Data were normalized against the value of the AL rat group, fixed as 1. Statistical significance: ** p < 0.01, Dunn’s test. AL: ad libitum; CR: caloric restriction; CR + RSV: caloric restriction and resveratrol (50 mg/kg/day; 6 weeks).
Figure 6
Figure 6
MtDNA relative copy number (A) and Western blot analysis of TFAM protein (B) in soleus muscle samples from AL, CR, and CR + RSV rats. The quantification of the intensity of the bands of TFAM (B), normalized to β-actin intensity, is reported above. At the bottom, the immunobands are indicative of two rats from each of the studied groups. Data shown derive from the results of triplicate Western blot experiments analyzed using the Kruskal–Wallis with Dunn’s post test. Bars indicate the mean values + SEM (n = 6 per group) for the three experimental groups. Data were normalized against the value of the AL rat group, fixed as 1. AL: ad libitum; CR: caloric restriction; CR + RSV: caloric restriction and resveratrol (50 mg/kg/day; 6 weeks).
Figure 7
Figure 7
Oxidative damage to mtDNA in soleus muscle samples from AL, CR, and CR + RSV rats. (A) Data are means + SEM (n = 6 per group) and were normalized against the value of the AL rats, fixed as 1. Bars in the graph represent the ratio between treated and untreated band intensities. Statistical significance: ** p < 0.01 (Kruskal–Wallis with Dunn’s post test). (B) An agarose gel representing amplicons derived from Fpg-treated and untreated total DNA of two rats from each of the studied groups. AL: ad libitum; CR: caloric restriction; CR + RSV: caloric restriction and resveratrol (50 mg/kg/day; 6 weeks).

References

    1. Picca A., Pesce V., Lezza A.M.S. Does eating less make you live longer and better? An update on calorie restriction. Clin. Interv. Aging. 2017;12:1887–1902. doi: 10.2147/CIA.S126458. - DOI - PMC - PubMed
    1. López-Otín C., Blasco M.A., Partridge L., Serrano M., Kroemer G. The hallmarks of aging. Cell. 2013;153:1194–1217. doi: 10.1016/j.cell.2013.05.039. - DOI - PMC - PubMed
    1. López-Otín C., Blasco M.A., Partridge L., Serrano M., Kroemer G. Hallmarks of aging: An expanding universe. Cell. 2023;186:243–278. doi: 10.1016/j.cell.2022.11.001. - DOI - PubMed
    1. Kroemer G., Maier A.B., Cuervo A.M., Gladyshev V.N., Ferrucci L., Gorbunova V., Kennedy B.K., Rando T.A., Seluanov A., Sierra F., et al. From geroscience to precision geromedicine: Understanding and managing aging. Cell. 2025;188:2043–2062. doi: 10.1016/j.cell.2025.03.011. - DOI - PMC - PubMed
    1. Suomalainen A., Nunnari J. Mitochondria at the crossroads of health and disease. Cell. 2024;187:2601–2627. doi: 10.1016/j.cell.2024.04.037. - DOI - PubMed

LinkOut - more resources