. 2025 Sep 3;13(9):943.
doi: 10.3390/vaccines13090943.

CXCR5 Signals Fine-Tune Dendritic Cell Transcription and Regulate TH2 Development

Affiliations

CXCR5 Signals Fine-Tune Dendritic Cell Transcription and Regulate TH2 Development

Miranda L Curtiss et al. Vaccines (Basel). .

Abstract

Background/objectives: We previously demonstrated that dendritic cell (DC) expression of CXCR5 is required for TH2 priming in mice infected with the helminth Heligmosomoides polygyrus (Hp). In this manuscript we examined how CXCR5 controls DC mediated CD4 T helper 2 cell (TH2) development.

Methods: We used in vitro TH2 priming assays, RNA-seq analyses and in vivo Hp infection mouse models to identify roles for the CXCR5-expressing DCs in TH2 development.

Results: We showed that migratory conventional type 2 dendritic cells (cDC2) express CXCR5 and that deletion of Cxcr5 prevents migratory DC priming of TH2 cells in vitro while overexpression of CXCR5 enhances migratory DC priming of TH2 cells in vitro. To understand how CXCR5 facilitates the TH2 priming capabilities of migratory cDC2 cells, we performed RNAseq analysis on wildtype and Cxcr5-/- DC subsets isolated from msLN of Hp-infected mice. We observed that CXCR5 expression specifically by the migratory cDC2 subset promoted a pro-proliferative transcriptional program in cDC2 cells and was required for cDC2 cell accumulation in the msLN following Hp infection. We demonstrated that CXCR5 expression specifically by cDC2 cells was necessary for upregulation of Chitinase 3-like-1 (Chi3l1), which encodes a secreted protein (Chi3l1) that regulates allergic TH2 responses. We showed that addition of recombinant Chi3l1 protein to in vitro TH2 priming cultures enhanced TH2 development and that deletion of Chi3l1 specifically in DCs resulted in fewer cDC2 cells and decreased TH2 development in vivo following Hp infection.

Conclusions: CXCR5 expressed by cDC2 cells is required for induction of Chi3l1, which in turn promotes the TH2 priming capacity of these DCs. These findings provide insight into the actions of CXCR5 and Chi3l1 in helminth infection.

Keywords: CXCR5; Chi3l1; TH2 responses; dendritic cells; helminth infection.


Conflict of interest statement

The authors declare no conflicts of interest.

Figures

Figure 1
Figure 1
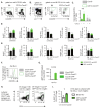
CXCR5 expression by mLN migratory DCs from Hp-infected mice promotes TH2 priming in vitro. (AC) Description of in vitro TH2 priming cultures using msLN migratory DCs from Hp-infected mice and CD4 T cells from OTII-4get IL4 reporter mice. CD45.1+ B6 recipient mice (n = 15) were irradiated and reconstituted with a 1:1 ratio of wildtype B6.CD45.1+ and Cxcr5−/− CD45.2+ BM cells, as shown in (A), to generate 1:1 B6:Cxcr5−/− chimeric mice. Chimeric mice were infected 8 weeks post-reconstitution with 200 Hp stage L3 larvae and msLN cells were isolated on day 8 post-infection. DCs were enriched with CD11c MACS beads and wildtype (CD45.1+) or Cxcr5−/− (CD45.2+) CD11c+MHCIIhi migratory DCs (B) were sort-purified and then incubated at a 1:10 ratio with splenic CD4 T cells (C) isolated from uninfected OTII.4get mice. Cultures included increasing concentrations of OVA peptide in the absence (TH0 conditions) or presence (TH2 conditions) of recombinant IL-4 (1000 U/mL) and blocking antibody to IFNg (2 mg/mL). (DF) CD4 T cells (7AADCD4+CD44hi) from the DC/OTII.4get T cell co-cultures were analyzed for expression of the IL-4 reporter, GFP, on day 4. Representative flow cytometry plots (D) showing GFP expression by OTII.4get CD4 T cells. The frequencies of IL-4 reporter expressing OTII.4get CD4 T cells in triplicate cultures containing CD45.1+ WT or CD45.2+ Cxcr5−/− DCs under TH0 (E) and TH2 (F) conditions are reported. Data representative of ≥3 independent experiments. Statistical analysis performed with unpaired 2-tailed Student’s t-test. * p ≤ 0.05. Portions of panel (C) created in BioRender. Curtiss, M. (2025) https://BioRender.com/ebwsrlb (accessed on 28 August 2025).
Figure 2
Figure 2
CXCR5 expression by msLN migratory DCs is restricted to the cDC2 compartment following Hp infection. (A,B) CXCR5 expression by msLN B cells from d8 Hp-infected B6 (n = 5) and Cxcr5−/− (n = 3) mice. Representative histogram (A) showing CXCR5 expression levels (mean fluorescence intensity, MFI) by B220+ msLN B cells from B6 mice (black line). FMO control (gray) included. Bar plot (B) reporting geometric MFI (gMFI) of CXCR5 expressed by msLN B cells from B6 and Cxcr5−/− mice. (CH) CXCR5 expression levels by msLN B220CD11c+MHCIIhi migratory DCs from d8 Hp-infected B6 mice (n = 5). Migratory DC subsets (C) were analyzed for expression of CXCR5. CXCR5 expression levels (D) reported as geometric mean fluorescence intensity (gMFI) and representative histograms showing CXCR5 expression levels (MFI) by cDC1 (E), DN (F), DP (G) and cDC2 (H) cells. Bars in (B,D) denote mean ± SD of each group. Statistical analysis performed with unpaired 2-tailed Student’s t-test (B) and one-way ANOVA (D), **** p ≤ 0.001, n.s. indicates p > 0.05.
Figure 3
Figure 3
Over-expression of CXCR5 by DCs from Hp-infected mice enhances in vitro TH2 priming. (A,B) Expression of CXCR5 and the transgene reporter, GFP, by msLN cells from naïve and day 8 Hp-infected B6 and CD11c-Cxcr5Tg mice (n = 6 mice/group, see Figure S1A,B for description of transgenic mice). Representative flow cytometry plots showing CXCR5 and GFP expression by B cells (A) and CD11c+Lin (7AADCD3B220NK1.1Ly6GLy6CCD64) DCs (B); gating strategies for resident and migratory DCs are found in Figure S1C. (C) CXCR5 transgene supports DC chemotaxis in vitro. Migration of DCs (n = 4 × 10⁵) isolated from spleens of uninfected CD11c-Cxcr5Tg and Cxcr5−/− mice (n = 3 per genotype) was measured by transwell assay with cells placed in the top chamber and 500 ng/mL recombinant CXCL13 placed in the bottom chamber. Transmigrated cells were enumerated after 90 min. (DG) Expression of CXCR5 and the transgene reporter, GFP, by resident and migratory DC populations from msLNs of naïve (n = 5–6/group) and day 8 Hp-infected (n = 6/group) CD11c-Cxcr5Tg and B6 mice. Numbers of msLN resident and migratory DC populations in uninfected (D) and infected (E) mice reported with GFP (black bars) and GFP+CXCR5+ DCs (green bars) shown. Representative histogram (F) showing CXCR5 expression by transgene positive (GFP+) and transgene negative (GFP) migratory CD11b+CD103 cDC2 cells with CXCR5 expression levels (G), reported as gMFI, provided. Flow plots showing CXCR5 and GFP expression by DC populations provided in Figure S1C–F. (H,I) TH2 priming capacity of migratory DCs is enhanced by CXCR5 transgene expression. CD11b+ migratory DCs from d8 Hp-infected C57BL/6 mice and transgene expressing (GFP+) CD11b+ migratory DCs from d8 Hp-infected CD11c-Cxcr5Tg mice (n = 5 mice/group) were sort-purified (Figure S1G) and co-cultured at a 1:10 ratio with splenic OTII.4get CD4 T cells in the presence of OVA peptide (0.01 mM). Representative flow plots showing expression of the IL-4 reporter by the gated CD4+ OTII cells (H) with the frequencies (I) of IL-4 reporter expressing (GFP+) CD4 T cells shown for triplicate cultures. Data representative of ≥3 independent experiments. Statistical analysis performed with unpaired 2-tailed Student’s t-test. Graphs show mean ± SD of each group. * p ≤ 0.05, ** p ≤ 0.01, **** p ≤ 0.0001.
Figure 4
Figure 4
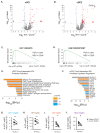
CXCR5 expression by msLN cDC2 cells promotes transcriptional proliferation programming and supports increased msLN DC recovery following Hp infection. (AF) Paired RNAseq analysis of B6 and Cxcr5−/− msLN migratory CD11bCD103+ cDC1 cells and CD11b+CD103 cDC2 cells isolated from Hp-infected 1:1 B6:Cxcr5−/− mice. 1:1 B6:Cxcr5−/− chimeric mice were generated (as in Figure 1A) and infected with Hp. B6 (CD45.1+) and Cxcr5−/− (CD45.2+) cDC1 (CD103+CD11b) and cDC2 (CD103+CD11b+) cells were sort-purified from individual animals as in Figure S2A,B and bulk RNA-sequencing was performed. (A,B) DEGs (FDR p < 0.05 and log2FC of >1 or <−1) for paired analysis of WT over Cxcr5−/− cDC1 (A) and cDC2 (B) cells shown as volcano plots. See Table S1 for complete gene expression profiles. (C,D) Gene set enrichment (GSEA) using mSigDB Hallmark gene sets to query ranked gene list of B6 cDC2 cells over Cxcr5−/− cDC2 cells. FDRq and normalized enrichment score indicated for E2F target (C) and G2M checkpoint (D) gene sets, which are significantly enriched in B6 cDC2 cells. See Table S2 for complete Hallmark gene set data. (E,F) Ingenuity pathway (Figure 4E and Table S3) and upstream regulator (Figure 4F and Table S4) analyses using the 85 genes (Table S1) meeting an FDR p < 0.05 cutoff when comparing gene expression between B6 and Cxcr5−/− cDC2 cells. The −log10 BH corrected p values and activation z-scores (activated in orange, inhibited in blue, indeterminate in gray) for predicted pathways and regulators are shown. (GJ) Maintenance and/or proliferation of CD11b+CD103 cDC2 cells and CD11bCD103 DN cells requires DC intrinsic expression of CXCR5. Enumeration of msLN migratory DC subsets from d8 Hp-infected 1:1 B6:Cxcr5−/− chimeric mice (generated as Figure 1A). Representative gating strategy to identify B6 and Cxcr5−/− msLN migratory cDC subpopulations in the same animal provided in Figure S3F–M. The number of wildtype B6 CD45.1+ (open circles) and Cxcr5−/− CD45.2+ (gray circles) msLN migratory CD103+CD11b cDC1 (G), CD103+CD11b+ DP (H), CD103CD11b DN (I) and CD103CD11b+ cDC2 (J) cells in the same animal are shown with pairs indicated by connecting line. The percentage of wildtype B6 CD45.1+ and Cxcr5−/− CD45.2+ msLN migratory cDC1 (Figure S3F,G), DP (Figure S3H,I), DN (Figure S3J,K), and cDC2 (Figure S3L,M) cells in the same animal are reported with pairs indicted by the connecting line. Statistical analysis for RNAseq datasets (AF) summarized in Methods. Statistical analysis in (GJ) performed with paired 2-tailed Student’s t-test. * p ≤ 0.05, n.s. indicates p > 0.05. Data representative of at least 3 independent experiments.
Figure 5
Figure 5
The CXCR5-dependent cDC2 gene product, Chi3l1, enhances TH2 priming in vitro and regulates the size of migratory DC subsets following Hp infection. (A) Chi3l1 mRNA expression levels (reported as RPKM) in B6 and Cxcr5−/− cDC1 and cDC2 cells from RNAseq analysis of Hp-infected 1:1 B6 Pepboy/Cxcr5 −/− chimeric mice (see Figure 4). (B,C) Recombinant Chi3l1 protein enhances TH2 priming in vitro. CD11b+ CD11c+MHCIIhi migratory DCs, sort-purified (see Figure S1G) from msLN of d8 Hp-infected B6 mice (n = 5 mice/group), were co-cultured at a 1:10 ratio with splenic OTII.4get CD4 T cells and OVA peptide (0.01 mM) in the absence or presence of 100 nM recombinant Chi3l1. Representative flow plots showing expression of the IL-4 reporter by the gated CD4+ OTII cells on day 4 of the cultures (B) with the frequencies (C) of IL-4 reporter expressing (GFP+) CD4 T cells provided for triplicate cultures. (D) Recombinant Chi3l1 is not sufficient to rescue defective TH2 priming by Cxcr5−/− migratory DCs. CD11c-enriched msLN cells from d8 Hp-infected C57BL/6 and Cxcr5−/− mice (n = 5 mice/group) were co-cultured at a 1:5 ratio with splenic OTII.4get CD4 T cells and OVA peptide (0.01 mM) in the presence or absence of 100 nM recombinant Chi3l1. Data shown as the frequencies of IL-4 reporter expressing (GFP+) CD4 T cells in triplicate cultures. (EH) Enumeration of BALB/c and Chi3l1−/− msLN migratory DC subsets in uninfected and d8 Hp-infected BALB/c (yellow bars) and Chi3l1−/− (black bars) mice (n = 5 mice/group). Data reported as number of total migratory DCs (Figure S4A,B), migratory CD103CD11b+ cDC2 (E), CD103CD11b DN (F), CD103+CD11b cDC1 (G) and CD103+CD11b+ DP (H) cells. Representative gating of msLN migratory DC subsets and frequencies of these subsets shown in Figure S4C. Data representative of ≥3 independent experiments, displayed as the mean ± SD of each group with individual animals depicted as circles (Chi3l1−/−) or triangles (BALB/c). Statistical significance was determined using unpaired 2-tailed Student’s t test (C,EH) or 1-way ANOVA (D). * p ≤ 0.05, ** p ≤ 0.01, *** p ≤ 0.001, **** p ≤ 0.0001, n.s. indicates p > 0.05.
Figure 6
Figure 6
DC intrinsic expression of Chi3l1 supports in vivo TH2 priming following Hp infection. (A) Description of BM chimeric model to test requirements for Chi3l1 expression by DCs during TH2 development in vivo. Thy1.2+ BALB/c recipients were irradiated and reconstituted with a 5:1 ratio of CD11cDTR Thy1.1+ BM cells plus BALB/c Thy1.2+ BM cells (DTR-BALB/c, yellow bars) or a 5:1 ratio of CD11cDTR Thy1.1+ BM cells plus Chi3l1−/− Thy1.2+ BM cells (DTR-Chi3l1−/−, black bars). Following 8 weeks of reconstitution, chimeric mice (n = 7group) were infected with Hp and exposed to 100 ng diphtheria toxin (DT) administered i.p. every 48 hours to eliminate DCs derived from the CD11cDTR Thy1.1+ genotype cells, leaving either 100% WT DCs (DTR-BALB/c chimeras) or 100% Chi3l1−/− DCs (DTR-Chi3l1−/− chimeras). Thy1.1+ T cells derived from the CD11cDTR Thy1.1+ BM precursors were all wild-type in both groups of mice and competent to express Chi3l1. (B) Enumeration of msLN Thy1.1+ wildtype CD4+ T cells in msLNs of d8 Hp-infected DT-treated DTR-BALB/c and DTR-Chi3l1−/− chimeras. (C,D) Enumeration of msLN Thy1.1+ wildtype TH2 cells from msLNs of d8 Hp-infected DT-treated DTR-BALB/c and DTR-Chi3l1−/− chimeras. MsLN cells from both groups of mice were isolated and restimulated in vitro in the presence of brefeldin A with or without plate-bound anti-CD3 antibody for 4 h, then analyzed by flow for intracellular cytokine expression. Representative flow plots (C) showing intracellular IL-4 and IL-13 expression by restimulated CD4+Thy1.1+CD44hi msLN cells are provided and the number of CD4+Thy1.1+CD44hi IL-4+IL-13+ cells (D) is reported. Data representative of ≥3 independent experiments, displayed as the mean ± SD of each group with individual animals depicted as circles (DTR- Chi3l1−/−) or triangles (DTR-WT). Statistical significance determined using unpaired 2-tailed Student’s t test. * p ≤ 0.05, ** p ≤ 0.01.

References

    1. Ronchese F., Webb G.R., Ochiai S., Lamiable O., Brewerton M. How type-2 dendritic cells induce Th2 differentiation: Instruction, repression, or fostering T cell-T cell communication? Allergy. 2025;80:395–407. doi: 10.1111/all.16337. - DOI - PMC - PubMed
    1. Cabeza-Cabrerizo M., Cardoso A., Minutti C.M., Pereira da Costa M., Reis e Sousa C. Dendritic Cells Revisited. Annu. Rev. Immunol. 2021;39:131–166. doi: 10.1146/annurev-immunol-061020-053707. - DOI - PubMed
    1. Leon B., Ballesteros-Tato A., Browning J.L., Dunn R., Randall T.D., Lund F.E. Regulation of T(H)2 development by CXCR5+ dendritic cells and lymphotoxin-expressing B cells. Nat. Immunol. 2012;13:681–690. doi: 10.1038/ni.2309. - DOI - PMC - PubMed
    1. Stagg A.J. Intestinal Dendritic Cells in Health and Gut Inflammation. Front. Immunol. 2018;9:2883. doi: 10.3389/fimmu.2018.02883. - DOI - PMC - PubMed
    1. Connor L.M., Tang S.C., Cognard E., Ochiai S., Hilligan K.L., Old S.I., Pellefigues C., White R.F., Patel D., Smith A.A., et al. Th2 responses are primed by skin dendritic cells with distinct transcriptional profiles. J. Exp. Med. 2017;214:125–142. doi: 10.1084/jem.20160470. - DOI - PMC - PubMed

LinkOut - more resources