. 2025 Sep 20;17(9):1275.
doi: 10.3390/v17091275.

Living Together Apart: Quantitative Perspectives on the Costs and Benefits of a Multipartite Genome Organization in Viruses

Affiliations

Living Together Apart: Quantitative Perspectives on the Costs and Benefits of a Multipartite Genome Organization in Viruses

Marcelle L Johnson et al. Viruses. .

Abstract

Background: Multipartite viruses individually package their multiple genome segments into virus particles, necessitating the transmission of multiple virus particles for effective viral spread. This dependence poses a cost in the form of reduced transmission compared to monopartite viruses, which only have a single genome segment. The notable cost of a multipartite genome organization has spurred debate on why multipartite viruses are so common among plant viruses, including a search for benefits associated with this organizational form.

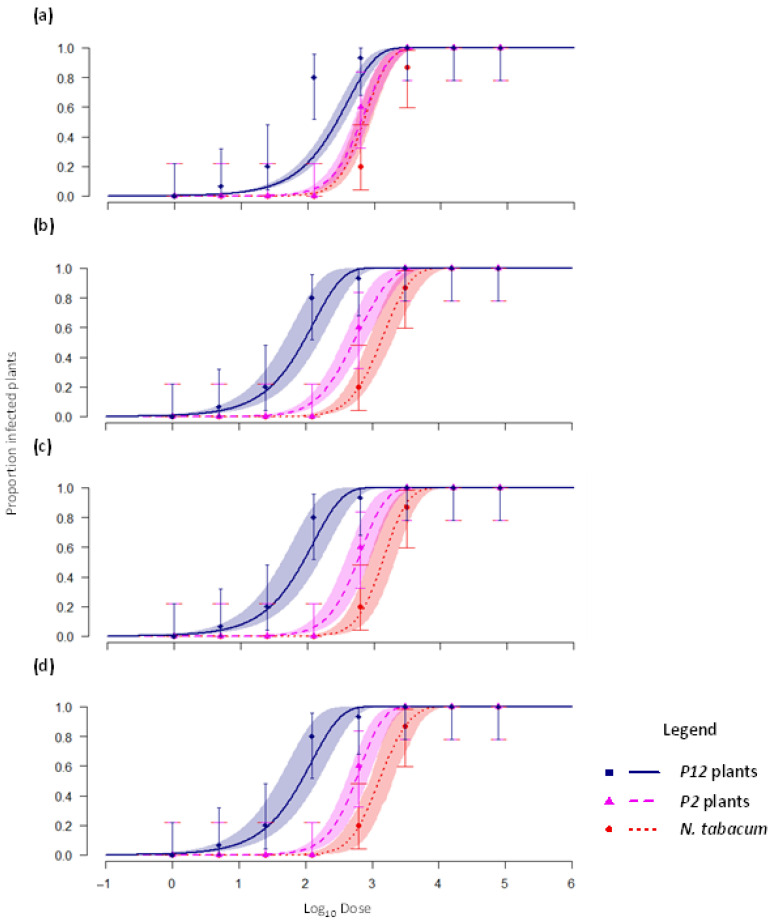
Methods: We investigated the costs and benefits of multipartite viruses with three approaches. First, we reanalyzed dose-response data to measure the cost of multipartition to between-host transmission for multipartite viruses. Second, we developed a simulation model to explore when the sharing of viral gene products between cells is beneficial. Third, we tested whether multipartite viruses have a broad host range by estimating the host range for plant viruses using metagenomics data.

Results: We find that the observed cost to transmission exceeds theoretical predictions. We predict that a virus gene-product-sharing strategy only confers benefits under limited conditions, suggesting that this strategy may not be common. Our results suggest that multipartite and segmented viruses have broader host ranges than monopartite viruses.

Conclusions: Our analyses also suggest there is limited evidence for the costs and benefits of a multipartite organization, and we argue that the diversity of multipartite virus-host systems demands pluralistic explanatory frameworks.

Keywords: dose response; evolution; gene-product sharing; host range; infection model; multipartite virus; plant virus; segmented virus.


Conflict of interest statement

The authors declare no conflicts of interest. The funders had no role in the design of the study; in the collection, analyses, or interpretation of data; in the writing of the manuscript; or in the decision to publish the results.

Figures

Figure A1
Figure A1
An overview of estimated model parameters for the infection model. The bars indicate the point estimate, and the error bars the 95% confidence interval. Parameter estimates are grouped per model fitted, and the bars for each model are given a different color for clarity. Values are reported in Table A1.
Figure A2
Figure A2
Fitted dose–response models (lines) and experimental data (symbols). The ordinate is the log transformed virus particle dose, and the abscissae is the proportion of infected plants. Lines indicate model predictions, the shaded area is the 95% confidence band for the model prediction, and symbols (squares, triangles and dots) indicate empirical data. Error bars indicate the binomial 95% confidence interval. Panels a–d correspond to Models 1–4, respectively. The null model, Model 1, underestimates the differences between the responses for the different plants, and therefore underestimates the cost of multipartition. The fit for Models 2–4 is very similar, although Model 4 is over-parameterized and has little support.
Figure A3
Figure A3
The effects of viral-gene-product sharing on performance. On the x-axis ρ is given, the proportion of viral gene products that is exported to other cells. On the y-axis the log10 of the cellular multiplicity of infection (MOI) is given. The heat indicates viral performance, as compared to a virus that does not share any gene products. When viral performance is better than the non-sharing reference (θi > 0) the area is green, when viral performance is worse (θi < 0) the area is purple, and when viral performance is similar (θi~0) the area is white. Contour lines have been included at the θi levels −0.6, −0.2, 0.2 and 0.6 to highlight parameter space with high or low performance. The value σ2 indicates how sensitive virus particle production is to changes in the genome formula, with low values (i.e., σ2 = 0.01) indicated high sensitivity and a quick drop in accumulation as the population moves away from the optimal value, and high values (i.e., σ2 = 10) indicating low sensitivity. Variable n indicates the number of cells in which the virus is passaged, and ψ indicates the amount of variation in the optimal GF allowed between passages. When virus accumulation is not sensitive to changes in the GF (σ2 ≥ 1), MOI is at intermediate values (3~log100.5), and gene-product sharing is low to moderate (≤0.6), gene-product sharing is predicted to offer an advantage. When the number of cells in which the virus is passaged is larger, gene-product sharing becomes more beneficial when σ2 = 10.
Figure 1
Figure 1
An overview of predictions and data for the cost of multipartition. Lines indicate model predictions, the shaded area is the 95% confidence band for the model prediction, and symbols (squares, triangles and dots) indicate empirical data. (a) Theoretical dose–response curves are shown for viruses with a different number of genome segments and balanced GF. As the number of segments increases, the dose response becomes steeper and shifts to the right. (b) Fitted Model 1 and experimental data from [6] are shown, where virus segments were made redundant by their constitutive expression in the host plant. For example, in the “monopartite” case, AMV RNA1 and RNA2 are expressed by the host plant and only RNA3 is required for infection. The dose–response predictions for the bipartite and tripartite viruses are different from those in panel a, both in terms of shape and relative position, because the AMV genome formula is not balanced. (c) Fitted model 3 and the same experimental data shown in (b) are shown. Models 2, 3, and 4 provide very similar predictions of dose response (Appendix Text A1 and Figure A2).
Figure 2
Figure 2
Overview of the different models fitted here. FP stands for free parameter, and ρ is the probability of infection per virus particle. Note the Model 4 only has 6 parameters (instead of 9) because when the transgenic plants express an AMV RNA, ρ is set to 1. Hence, for the P2 and P12 plants there are 2 and 1 free parameters, respectively.
Figure 3
Figure 3
Virus gene-product-sharing model. Panels (a,b) illustrate the model, with a legend directly below the two panels. The blue and green bars illustrate the two different virus genome segments, and their cognate gene products are shown with blue circles and green triangles, respectively. When genome segments are packaged into virus particles, a rectangle is drawn around the segment. The large tan rectangles represent host cells. In the first round of infection (T = 1), a single cell is infected by virus particles in a 1:1 ratio for segments 1 and 2. In this example, we assume the production of virus resources is sensitive to changes in the proportion of gene products. A fraction ρ of the gene products in each infected cell will be shared uniformly with all other susceptible cells introduced in the next round of infection (T = 2). We only illustrate the gene products that are shared between cells. (a) There is no gene-product sharing and infection does not proceed in cells missing one of the two segments. When the genome formula deviates from 1:1, virus-particle production is lower. (b) Half of the gene products are shared (ρ = 0.5), and replication is supported in cells missing one segment. When the ratio of gene products deviates from 1:1 in a cell, the total virus resources generated are lower. When only one segment is present in a cell, only that segment can be replicated and its gene products produced. Panels (c,d) illustrate the effects of viral-gene-product sharing on the within-host fitness of a bipartite virus. The x-axis indicates the fraction of cellular resources used for gene-product sharing ρ, whereas the y-axis indicates the cellular multiplicity of infection (MOI). The colors indicate viral fitness compared to a virus that does not share its gene products, as determined by total virus particle production during a simulation of multiple rounds of infection. Contour lines have been included to highlight parameter space with high or low fitness. Model parameter σ2 determines how sensitive virus particle yield is to changes in the genome formula, with high values (σ2>1) corresponding to low sensitivity. (c) When σ2 = 1, gene-product sharing was not beneficial. For lower values of σ2, gene-product sharing never leads to increased fitness (See Appendix B). (d) Gene-product sharing was beneficial in a small region of parameter space for the highest value of σ2, when virus particle production is insensitive to changes in the genome formula. For each condition, 104 simulations were run with five cells per round of replication and 20 rounds of replication.
Figure 4
Figure 4
Schematic overview of virus host range analysis.

References

    1. Sicard A., Michalakis Y., Gutiérrez S., Blanc S. The strange lifestyle of multipartite viruses. PLoS Pathog. 2016;12:e1005819. doi: 10.1371/journal.ppat.1005819. - DOI - PMC - PubMed
    1. Diefenbacher M., Sun J., Brooke C. The parts are greater than the whole: The role of semi-infectious particles in influenza A virus biology. Curr. Opin. Virol. 2018;33:42–46. doi: 10.1016/j.coviro.2018.07.002. - DOI - PMC - PubMed
    1. Wichgers Schreur P.J., Kortekaas J. Single-molecule FISH reveals non-selective packaging of Rift Valley fever virus genome segments. PLoS Pathog. 2016;12:e1005800. doi: 10.1371/journal.ppat.1005800. - DOI - PMC - PubMed
    1. Fulton R.W. The effect of dilution on Necrotic ringspot virus infectivity and the enhancement of infectivity by noninfective virus. Virology. 1962;18:477–485. doi: 10.1016/0042-6822(62)90038-7. - DOI - PubMed
    1. Iranzo J., Manrubia S.C. Evolutionary dynamics of genome segmentation in multipartite viruses. Proc. R. Soc. B Biol. Sci. 2012;279:3812–3819. doi: 10.1098/rspb.2012.1086. - DOI - PMC - PubMed

LinkOut - more resources