. 2025 Sep 26;20(1):98.
doi: 10.1186/s13024-025-00889-y.

A novel alpha-synuclein G14R missense variant is associated with atypical neuropathological features

Affiliations

A novel alpha-synuclein G14R missense variant is associated with atypical neuropathological features

Christof Brücke et al. Mol Neurodegener. .

Abstract

Background: Parkinson's disease (PD) affects millions of people worldwide, but only 5-10% of patients suffer from a monogenic forms of the disease with Mendelian inheritance. SNCA, the gene encoding for the protein alpha-synuclein (aSyn), was the first to be associated with familial forms of PD and, since then, several missense variants and multiplications of the gene have been established as rare causes of autosomal dominant forms of PD. In this study, we report the identification of a novel SNCA mutation in a patient that presented with a complex neurogenerative disorder, and unconventional neuropathological findings. We also performed in depth molecular studies of the effects of the novel aSyn mutation.

Methods: A patient carrying the novel aSyn missense mutation and the family members were studied. We present the clinical features, genetic testing-whole exome sequencing (WES), and neuropathological findings. The functional consequences of this aSyn variant were extensively investigated using biochemical, biophysical, and cellular assays.

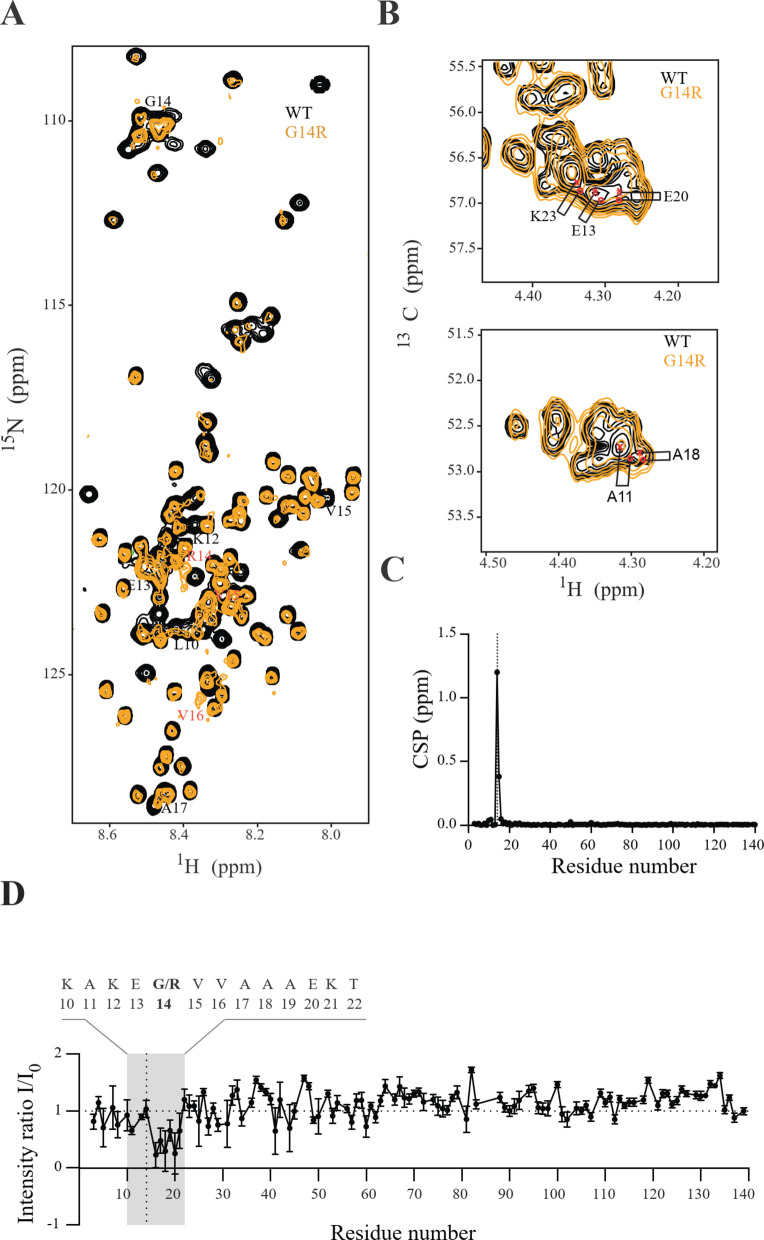
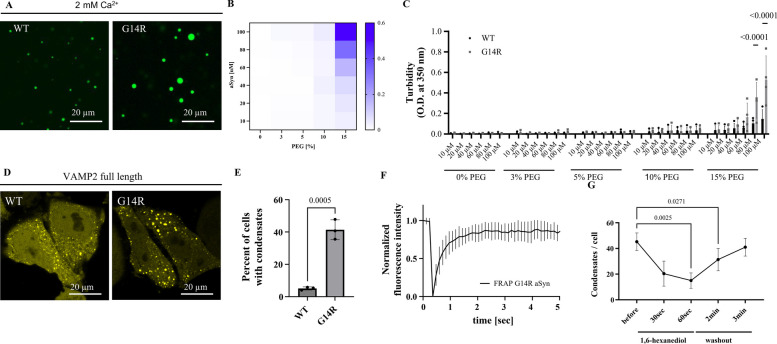
Results: The patient exhibited a complex neurodegenerative disease that included generalized myocloni, bradykinesia, dystonia of the left arm and apraxia. WES identified a novel heterozygous SNCA variant (cDNA 40G > A; protein G14R). Neuropathological examination showed extensive atypical aSyn pathology with frontotemporal lobar degeneration (FTLD)-type distribution and nigral degeneration pattern with abundant ring-like neuronal inclusions, and few oligodendroglial inclusions. Sanger sequencing confirmed the SNCA variant in one healthy, 86-year-old parent of the patient suggesting incomplete penetrance. NMR studies suggest that the G14R mutation induces a local structural alteration in aSyn, and lower thioflavin T binding in in vitro fibrillization assays. Interestingly, the G14R aSyn fibers display different fibrillar morphologies than Lewy bodies as revealed by cryo-electron microscopy. Cellular studies of the G14R variant revealed increased inclusion formation, enhanced membrane association, and impaired dynamic reversibility of serine-129 phosphorylation.

Conclusions: The atypical neuropathological features observed, which are reminiscent of those observed for the G51D aSyn variant, suggest a causal role of the SNCA variant with a distinct clinical and pathological phenotype, which is further supported by the properties of the mutant aSyn.

Keywords: Aggregation; Alpha-synuclein; Bradykinesia; Dystonia; Parkinson´s disease.


Conflict of interest statement

Declarations. Ethics approval and consent to participate: The study received the approval of the ethics committee of the Medical University of Vienna (EK1844/2019), and written informed consent was obtained from all subjects involved to participate in the genetic research described in this study. All animal procedures were conducted in accordance with the approval from the Institutional Animal Care and Use Committee at BWH, under protocol number 2016N000305. Consent for publication: All authors have read and approved the manuscript submitted. Competing interests: The authors declare no competing interests.

Figures

Fig. 1
Fig. 1
aSyn pathology in the cortical and hippocampal regions. A-C: HE-stained sections of the cingulate cortex show thinning of the cortical ribbon (A), neuronal loss preferentially involving the upper third of the cortex (B), and laminar superficial spongiosis (C). D-I: Immunohistochemistry for aSyn reveals a high pathology density with a spectrum of morphologies of the inclusions: ring-like with abundant fine neurites in superficial cortical areas (E), half-moon shaped in deeper layers (F), again ring-like in the dentate gyrus of the hippocampus (G, g), alternating with more compact and spherical (H, h) or tangle-like in pyramidal neurons of the CA1 sector of the hippocampus (I,i). (Immunohistochemical sections were slightly counterstained with haematoxylin). Scale bars: B, D: 100 µm; C: 20 µm; E, F, G1: 10 µm; G, H, I, H1, I1: 10 µm; A: original magnification × 0,6
Fig. 2
Fig. 2
aSyn pathology in the midbrain. A: Horizontal section through the midbrain reveals moderate pallor of the s. nigra. B, C, E: HE-stained sections show a moderate loss of pigmented cells of the s. nigra and locus coeruleus with extracellular pigment (B), and some cytoplasmic pale bodies (C, arrows) displacing neuromelanin granules. Interestingly, immunohistochemistry for aSyn (D, F) shows only mild pathology in the form of some diffuse and spherical cytoplasmic inclusions in the S.N. (C, arrows) and a few more in the L.C., associated with some neurites (F). (Immunohistochemical sections were slightly counterstained with haematoxylin). Scale bars: D, F: 20 µm; E: 10 µm; G, H, I: 50 µm; B: original magnification × 0,6, C: original magnification × 2,6
Fig. 3
Fig. 3
Effect of G14R mutation on aSyn structure. A 1H/15N-HSQC of wild type (WT, black) and G14R mutant (orange) aSyn. The affected residues are labeled. B Selected region of the 1H/13C HSQC of WT (black) and G14R (orange) aSyn. The most perturbed residues are labeled. C N-HN Chemical Shift Perturbations between WT and G14R aSyn based on the spectrum in a. D Residue-specific 1H/15N-HSQC peak intensity ratios for WT and G14R aSyn
Fig. 4
Fig. 4
G14R aggregation propensity. AC ThT-based aggregation assays. A Aggregation kinetics of WT and G14R aSyn. B Lag time (hours) derived from kinetic curves. C Normalized maximum ThT fluorescence intensity shown as percentage relative to the highest signal within each independent experiment. Each dot represents a technical replicate from 5 independent experiments (N = 5). Curves were normalized to the maximum fluorescence intensity per run. Data are shown as mean ± SEM. Statistical comparisons in (B) and (C) were made using Student’s t-test. DG Effect of G14R mutation on inclusion formation in H4 cells. D Schematic of the aggregation model based on co-expression of SynT and synphilin-1. E Representative immunocytochemistry images showing inclusion patterns for WT and G14R aSyn (scale bar: 20 μm). FG Quantification of inclusion number (F) and area for individual inclusions per cell (G). 50 cells per condition were analyzed using a 100 × objective. Cells were categorized into four groups based on inclusion pattern. Data represent three biological replicates (N = 3) and are shown as mean ± SEM. Statistical analysis was performed using Student’s t-test
Fig. 5
Fig. 5
Characteristics of WT and G14R aSyn filaments. A TEM micrograph of wild-type (WT) aSyn amyloid filaments. Black arrows mark select filament ends. Scale bar: 100 nm. B TEM micrograph of G14R aSyn amyloid filaments. In the micrograph multiple aggregates consisting of laterally associated filaments can be seen. Black arrows indicate filament ends of exemplary filaments that were used for SPA processing. Scale bar: 100 nm. C 2D class averages (706 Å box size) of twisting WT aSyn fibrils, showing an interaction between two protofilaments. D 2D class averages (706 Å box size) of twisting WT aSyn filaments, showing interaction between two protofilaments (2PF) or a single protofilament (1PF). Scale bar: 50 nm. E Overview of the electron density map of WT aSyn filaments. F Overview of the electron density map of G14R aSyn filaments. G Amino acid sequence of human aSyn with distinct regions color-coded (N-Terminus in orange, middle hydrophobic region in purple, and C-Terminus in green). Scale bar: 50 nm. H The electron density map together with the atomic model of WT aSyn amyloid filaments featuring a single beta-sheet layer formed by two interacting protofilaments. The protofilament interface is stabilized by a K45-E57 salt bridge. I The electron density map together with the atomic model of a single beta-sheet of G14R aSyn amyloid filaments. The mutated residue is indicated in red, while residues forming the salt-bridge in the WT are marked in green
Fig. 6
Fig. 6
aSyn G14R shows increased condensate formation in vitro and in cells. A aSyn phase separation in the presence of 2 mM Ca2+ and crowding with 15% PEG 8000, immediately after PEG addition for aSyn wildtype (WT) and the disease variant aSyn G14R. aSyn concentration used: 100 µM. B Heatmap for turbidity measurements of aSyn phase separation in the presence of 2 mM Ca2+. Data derived from 4 independent repeats. C Comparison of aSyn phase separation derived from (B) showing increased condensate formation for the aSyn G14R disease variant. n = 4, n represents independent repeats. Data are represented as mean ± SEM. 2way ANOVA, Šídák's multiple comparisons test. D Condensate formation of aSyn WT YFP and aSyn G14R YFP upon ectopic expression with VAMP2 in HeLa cells. aSyn G14R YFP shows increased condensate formation in cells. E Quantification of condensate formation. Data derived from incuCyte screening, 16 images per well, 3 wells per biological repeat, 3 biological repeats. n indicates biological repeats. Data are represented as mean ± SD. Unpaired two-tailed t-test. F Quantification of fluorescence recovery after photobleaching (FRAP) of aSyn G14R YFP condensate in cells. Data are represented as mean ± SEM. 3 biological repeats, n = 11, n represents individual FRAP experiments. G aSyn G14R YFP condensates show dispersal and recovery upon incubation with 3% 1,6 hexanediol. n = 8, n represents individual cells
Fig. 7
Fig. 7
Dynamic activity‐dependent pS129 of G14R and WT aSyn. Schematic of aSyn structure showing the KTKEGV repeat motif (where most familial PD mutations occur), central hydrophobic region, and C-terminal region. Below is the aSyn sequence alignment, with conserved KTKEGV amino acids in yellow and familial PD mutation sites in orange. The experimental setup is displayed on the right. B Representative western blot (WB) for total aSyn and pS129 from DIV17‐21 rat SNCA−/− cortical neurons transduced with WT and G14R aSyn. The quantification analysis from WB is shown below. C WB of WT and G14R transduced rat SNCA−/− cortical neurons that at DIV17‐21 underwent on-plate sequential extraction to separate the cytosolic (C) and membrane (M) fractions. Total aSyn was detected using the MJFR1 antibody, and the controls for the cytosolic and membrane fractions were GAPDH and Calnexin, respectively. D quantification of the solubility of WT and G14R aSyn from WB presented in (C). E Overview of the experimental conditions to investigate the dynamic reversibility of pS129. Details are present in the main text. F-G Neuronal activity-induced reversible pS129 (illustrated in schematic E) was observed in DIV17‐21 rat SNCA −/− cortical neurons transduced with WT and G14R aSyn, respectively, using 20 μM picrotoxin (PTX) for stimulation and 1 μM tetrodotoxin (TTX) for inhibition. WB for quantifying total aSyn and pS129 was employed. H The percentage of increase in pS129 relative to baseline for WT and G14R aSyn after 2 h or 4 h PTX stimulation (derived from F to G). I The percentage of TTX‐resistant pS129 in WT and G14R variants (derived from F to G) relative to the basal state (DMSO vehicle). J The percentage of irreversible pS129 relative (derived from F to G) relative to the basal state (DMSO vehicle). K The percentage of irreversible pS129 relative to 2 h PTX stimulation (derived from F to G). L The percentage of irreversible pS129 relative to 4 h PTX stimulation (derived from F to G). ****P < 0·0001; ***P < 0·001; *P < 0·05; ns, not significant. The error bar was mean ± SD

Update of

References

    1. Flores-Leon M, Outeiro TF. More than meets the eye in Parkinson’s disease and other synucleinopathies: from proteinopathy to lipidopathy. Acta Neuropathol. 2023;146:369–85. - PMC - PubMed
    1. Polymeropoulos MH, Lavedan C, Leroy E, et al. Mutation in the α-synuclein gene identified in families with Parkinson’s disease. Science. 1997;276:2045–7. - PubMed
    1. Spillantini MG, Schmidt ML, Lee VMY, Trojanowski JQ, Jakes R. Goedert M α-synuclein in Lewy bodies. Nature. 1997;388:839–40. - PubMed
    1. Golbe LI, Di Iorio G, Sanges G, et al. Clinical genetic analysis of Parkinson’s disease in the Contursi kindred. Ann Neurol. 1996;40:767–75. - PubMed
    1. Appel-Cresswell S, Vilarino-Guell C, Encarnacion M, et al. Alpha-synuclein pH50Q, a novel pathogenic mutation for Parkinson’s disease. Mov Disord. 2013;28:811–3. - PubMed

LinkOut - more resources