. 2025 Sep 26;23(1):609.
doi: 10.1186/s12951-025-03696-1.

Biomimetic Cu2-xSe nanoplatforms for efficient glioblastoma treatment: overcoming the blood-brain barrier and boosting Immunogenetic cell death

Affiliations

Biomimetic Cu2-xSe nanoplatforms for efficient glioblastoma treatment: overcoming the blood-brain barrier and boosting Immunogenetic cell death

Sijia Lin et al. J Nanobiotechnology. .

Abstract

Glioblastoma (GBM) is an aggressive and highly heterogeneous brain tumor that continues to pose a significant clinical challenge. Current therapeutic strategies, including surgical resection, radiotherapy, and chemotherapy, are hindered by the tumor's invasive behavior, resistance to treatment, and the difficulty of selectively targeting tumor cells. Emerging modalities, such as immunotherapy and photodynamic therapy, hold considerable promise; however, their efficacy in treating GBM is limited by critical barriers, including poor penetration of the blood-brain barrier (BBB), tumor heterogeneity, and insufficient accumulation of therapeutic agents at the tumor site. In this study, innovative biomimetic copper selenide nanoparticles (CS@CM) are developed for targeted photothermal therapy of GBM. These nanoparticles are functionalized with glioma cell membranes (CM), and this biomimetic design leverages the homing capability of the membranes to achieve efficient BBB penetration and enhanced targeting of GBM tissues. CS@CM act as potent photothermal agents upon light activation, which can amplify reactive oxygen species-induced oxidative stress to damage glioma cells. Such combination therapy effectively triggers immunogenic cell death to achieve splendid antitumor efficacy, offering a promising therapeutic strategy for GBM. Collectively, this approach addresses the limitations of conventional treatments, paving the way for improved clinical outcomes in managing this formidable malignancy.

Keywords: Blood-brain barrier penetration; Glioblastoma therapy; Immunogenetic cell death; Oxidative damage.


Conflict of interest statement

Declarations. Competing interests: The authors declare no competing interests.

Figures
Scheme 1
Scheme 1
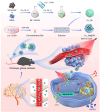
Diagrammatic representation of the synthetic procedure of CS@CM and its therapeutic mechanism toward orthotopic GBM
Fig. 1
Fig. 1
Structural characterizations. (a) TEM image and (b) HR-TEM image of CS. (c) TEM image of CS@CM. (d) AFM image of CS. (e) Hydrodynamic dimensions of CS and CS@CM as determined by DLS. (f) Zeta potentials of CM, CS, and CS@CM. (g) XRD pattern of CS. (h) Core-level XPS spectra of Cu 2p. (i) FTIR spectra of PVP, CS, and CS@CM. (j) UV-visible spectra of CS at different concentrations (0, 1.25, 2.5, And 5 mg mL−1). (k) SDS-PAGE analysis of CM, CS, and CS@CM
Fig. 2
Fig. 2
Photothermal property and ROS generation capability of CS@CM. (a) Heating curve of the aqueous solution containing CS or CS@CM (2 mg/mL) during irradiation with a 1064 nm laser for 30 min. (b) Temperature change of CS@CM dispersion (2 mg/mL) under four cycles of cyclic NIR irradiation (1064 nm, laser on for 7 min per cycle). (c) Thermal mapping of different concentrations of CS@CM under 1064 nm laser irradiation for different periods. (d) Absorption spectra of OPD (2 mg/mL) after reacting with various agents (100 µg/mL) in the presence of H2O2 (100 µM) for 30 min. (e) Absorption spectra of OPD (2 mg/mL) after reacting with CS@CM at different concentrations (0–100 µg/mL) in the presence of H2O2 for 30 min. (f) Absorption spectra of MB (0.5 mg/mL) after reacting with various agents (100 µg/mL) in the presence of H2O2 (100 µM) for 30 min. Absorption spectra of (g) MB (0.5 mg/mL), (h) TMB (0.5 mM) and (i) ABTS (0.5 mM) after reacting with CS@CM at different concentrations (0–100 µg/mL) in the presence of H2O2 (100 µM) for 30 min. (j) Fluorescence emission spectra of TA (6 mM) after reacting with CS@CM (100 µg/mL) in the presence of H2O2 (100 µM) for 30 min. (k) ESR spectrum of CS@CM (100 µg/mL) in the H2O2 solution (100 µM) containing the spin trap of DMPO (100 mM). NIR-II laser (1064 nm) irradiation was carried out for 5 min in the applicable groups. (l) Dissolved oxygen level in H2O2 solution (100 µM) containing CS@CM (100 µg/mL) during incubation for 9 min
Fig. 3
Fig. 3
Cellular uptake and cytotoxicity of CS@CM in vitro. Confocal microscopic images of GL261 glioma cells after incubation with Cy5.5-labeled (a) CS and (b) CS@CM for different periods (scale bar: 200 μm). Cell nucleus and cytoskeleton are fluorescently labeled with DAPI and phalloidin-FITC, respectively. Quantitative analysis of the MFI of Cy5.5-labeled (c) CS and (d) CS@CM. (e) Confocal microscopic images of GL261 cells after various treatments and stained with DCFH-DA fluorescent probe (scale bar: 200 μm). (f) MFI of DCF in different groups corresponding to panel (e). Cell viability of GL261 cell after treatment with CS@CM at the concentration of (g) 25 µg/mL, (h) 50 µg/mL, (i) 100 µg/mL, and (j) 200 µg/mL, with or without 1064 nm laser irradiation. (k) Flow cytometry dot plots of GL261 cells subject various treatments and stained with Annexin V-FITC/PI. (l) Histogram to quantify cell number in the stages of non-apoptosis, early apoptosis, late apoptosis and necrosis stages corresponding to panel (k). Groups are assigned to be (1) Blank, (2) Laser, (3) CS, (4) CS + laser, (5) CS@CM, (6) CS@CM + laser. Data are displayed as mean ± SD (n = 4). *p < 0.05, **p < 0.01, ***p < 0.001
Fig. 4
Fig. 4
DAMPs release from GL261 cells in vitro. (a) Confocal microscopy images of GL261 cells after various treatments and stained with CRT (scale bar: 50 μm). (b) MFI of CRT corresponding to panel (a). (c) Flow cytometric dot plots to analysis the fluorescence intensity of CRT. (d) Confocal microscopy images of GL261 cells after diverse administrations and stained with HMGB1 (scale bar: 50 μm). (e) MFI of HMGB1 corresponding to panel (d). (f) The amount of ATP released from GL261 cells subject to different treatments. (g) The remnant ATP in cytoplastic region in terms of various regiments. (h) Schematic diagram to illustrate the DAMPs release for ICD stimulation. Groups are assigned to be (1) Blank, (2) Laser, (3) CS, (4) CS + laser, (5) CS@CM, (6) CS@CM + laser. Data are displayed as mean ± SD (n = 4). *p < 0.05, **p < 0.01, ***p < 0.001
Fig. 5
Fig. 5
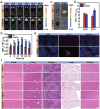
Biodistribution of Cy5.5-labeled CS@CM in brain region after intravenous injection. (a) In vivo fluorescence imaging of the brain cerebral site in GL261 glioma-bearing C57BL/6 mice at different time points (4, 6, 8, 12, 24, And 36 h) following intravenous injection of Cy5.5-labeled CS or CS@CM (5 mg/kg). (b) MFI in brain region corresponding to panel (a). (c) Ex vivo fluorescence images of the Heart And brain tissue at 12 h post-injection of different agents in GBM-bearing mice. (d) MFI in different tissues corresponding to panel (c). (e) Representative fluorescence images of brain sections at 12 h post-injection of CS or CS@CM (scale bar: 250 μm). (f) H&E staining of the histological sections of major organs on day 28 in terms of different treatment groups (scale bar: 200 μm). Data are displayed as mean ± SD (n = 4). **p < 0.01, ***p < 0.001
Fig. 6
Fig. 6
GBM inhibition in vivo. (a) Timing program of the treatment procedures for animal experiments. (b) NIR thermographic images in orthotopic GBM-bearing C57BL/6 mice under 1064 nm laser irradiation (1 W/cm2) one day after intravenous injection with CS or CS@CM (5 mg/kg). (c) Temperature elevation curves at tumor site corresponding to panel (b). (d) Bioluminescence images of GBM-bearing C57BL/6 mice on day 0, 14 And 28. (e) MFI of the tumor site corresponding to panel (d). (f) Tumor inhibition rate in terms of different administrations. (g) Kaplan-Meier survival curves of mouse models after receiving diverse regimens. (h) H&E staining of the cerebral tissue sections. The area enclosed by the dashed line represents the GBM region. Groups are assigned to be (1) Blank, (2) CS, (3) CS + laser, (4) CS@CM, (5) CS@CM + laser. Data are displayed as mean ± SD (n = 4). ***p < 0.001

References

    1. Davis ME. Glioblastoma: overview of disease and treatment. Clin J Oncol Nurs. 2016;20:S2–8. - PMC - PubMed
    1. Rong L, Li N, Zhang Z. Emerging therapies for glioblastoma: current state and future directions. J Exp Clin Cancer Res. 2022;41:142. - PMC - PubMed
    1. Wu W, Klockow JL, Zhang M, Lafortune F, Chang E, Jin L, et al. Glioblastoma multiforme (GBM): an overview of current therapies and mechanisms of resistance. Pharmacol Res. 2021;171:105780. - PMC - PubMed
    1. Zhu L, Jiang M, Wang H, Sun H, Zhu J, Zhao W, Fang Q, Yu J, Chen P, Wu S, Zheng Z, He Y. A narrative review of tumor heterogeneity and challenges to tumor drug therapy. Ann Transl Med. 2021;9:1351. - PMC - PubMed
    1. Rabah N, Ait Mohand FE, Kravchenko-Balasha N. Understanding glioblastoma signaling, heterogeneity, invasiveness, and drug delivery barriers. Int J Mol Sci. 2023;24:14256. - PMC - PubMed

LinkOut - more resources