

Evaluation of PD-L1 Expression in Patients With Non-Small Cell Lung Cancer Using DCE-MRI Quantitative Analysis
- PMID: 41014107
- PMCID: PMC12475933
- DOI: 10.1111/crj.70125
Evaluation of PD-L1 Expression in Patients With Non-Small Cell Lung Cancer Using DCE-MRI Quantitative Analysis
Abstract
Purpose: The aim is to evaluate the expression of programmed death ligand 1 (PD-L1) in patients with non-small cell lung cancer (NSCLC) using quantitative perfusion parameters based on dynamic contrast-enhanced magnetic resonance imaging (DCE-MRI).
Methods: A total of 35 patients with a confirmed diagnosis of NSCLC and sufficient tissue pathology were enrolled in the study. The immunohistochemical (IHC) results were used as the gold standard to determine the thresholds for grouping the patients. The patients were divided into three categories based on their PD-L1 expression: (1) PD-L1-negative (IHC < 1%) and PD-L1-positive (IHC ≥ 1%); (2) PD-L1 weak (IHC < 50%) and strong expression (IHC ≥ 50%); and (3) PD-L1 nonexpression (IHC < 1%), low expression (IHC between 1% and 49%), and high expression (IHC ≥ 50%). DCE-MRI datasets were analyzed to acquire histogram parameters, including mean value, uniformity, skewness, kurtosis, entropy, energy, and quantity, of quantitative perfusion parameters using the extended Tofts model (ETM) and the exchange model (ECM). Subsequently, the parameters were compared between the aforementioned groups.
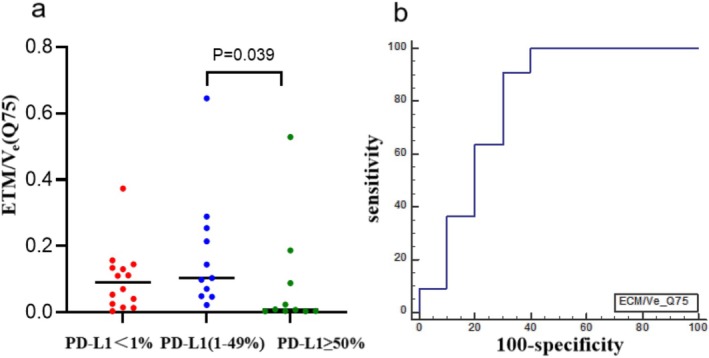
Results: IHC showed PD-L1 < 1% in 20 cases, PD-L1 (1%-49%) in 14 cases, and PD-L1 ≥ 50% in 14 cases. At a threshold of 50%, statistically significant differences were observed for ETM/Ktrans (Q25 and Q50), ETM/Kep (Q10), and ECM/Ve (Q75 and Q90), with values being higher in the weak PD-L1 expression group. With thresholds of 1% and 50%, the results of the pairwise comparison showed that the ECM/Ve (Q75) value in the low PD-L1 expression group was significantly higher than that in the high PD-L1 expression group.
Conclusion: DCE-MRI quantitative analysis is a valuable tool for the evaluation of PD-L1 expression in NSCLC. It provides a noninvasive method that can be employed as an adjunctive technique for the stratification of PD-L1 expression in patients with NSCLC.
Keywords: histogram; magnetic resonance imaging; non–small cell lung cancer; programmed death ligand‐1; quantitative analysis.
© 2025 The Author(s). The Clinical Respiratory Journal published by John Wiley & Sons Ltd.
Conflict of interest statement
The authors declare no conflicts of interest.
Figures


References
-
- Sung H., Ferlay J., Siegel R. L., et al., “Global Cancer Statistics 2020: GLOBOCAN Estimates of Incidence and Mortality Worldwide for 36 Cancers in 185 Countries,” CA: A Cancer Journal for Clinicians 71, no. 3 (2021): 209–249. - PubMed
-
- Lefebvre C., Martin E., Hendriks L. E. L., et al., “Immune Checkpoint Inhibitors Versus Second Line Chemotherapy for Patients With Lung Cancer Refractory to First Line Chemotherapy,” Respiratory Medicine and Research 78 (2020): 100788. - PubMed
-
- Urushibara M., Ishizaka K., Matsutani N., et al., “Differential Treatment Responses to Immune Checkpoint Inhibitor (ICI) Therapy in a Case of Multiple Primary Malignancies: The Programmed Death Ligand‐1 (PD‐L1) Negative Ureteral and Lung Metastasis From a Clear Cell Renal Cell Carcinoma Appearing After Robotic‐ Assisted Partial Nephrectomy Progressed After ICI Therapy, While Synchronous PD‐L1‐Positive Primary Lung Squamous Cell Carcinoma Responded Very Well to ICI Therapy: A Case Report,” World Journal of Surgical Oncology 21, no. 1 (2023): 37. - PMC - PubMed
MeSH terms
Substances
Grants and funding
LinkOut - more resources
Full Text Sources
Medical
Research Materials
