Clinical Trial
. 2025 Sep 27;214(1):47.
doi: 10.1007/s00430-025-00847-x.

Effect of controlled human Plasmodium falciparum infection on B cell subsets in individuals with different levels of malaria immunity

Affiliations
Clinical Trial

Effect of controlled human Plasmodium falciparum infection on B cell subsets in individuals with different levels of malaria immunity

Pilar Requena et al. Med Microbiol Immunol. .

Abstract

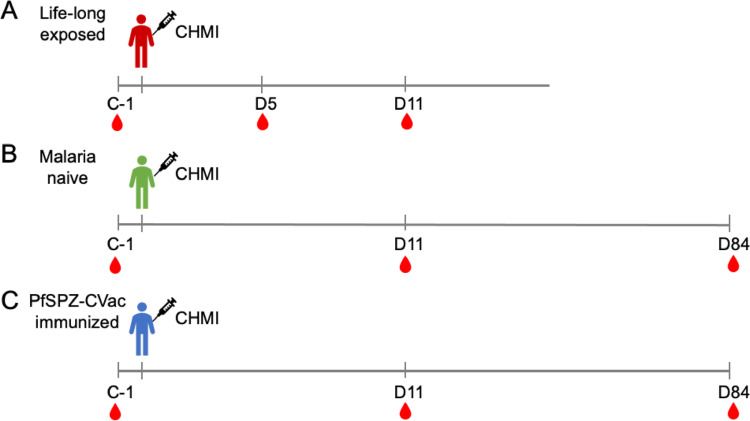
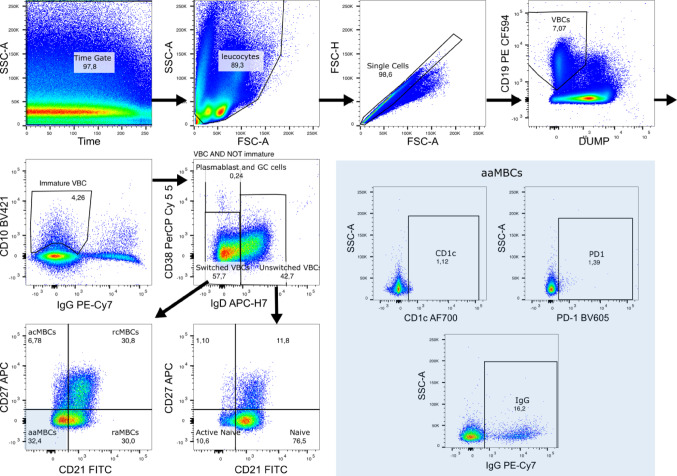
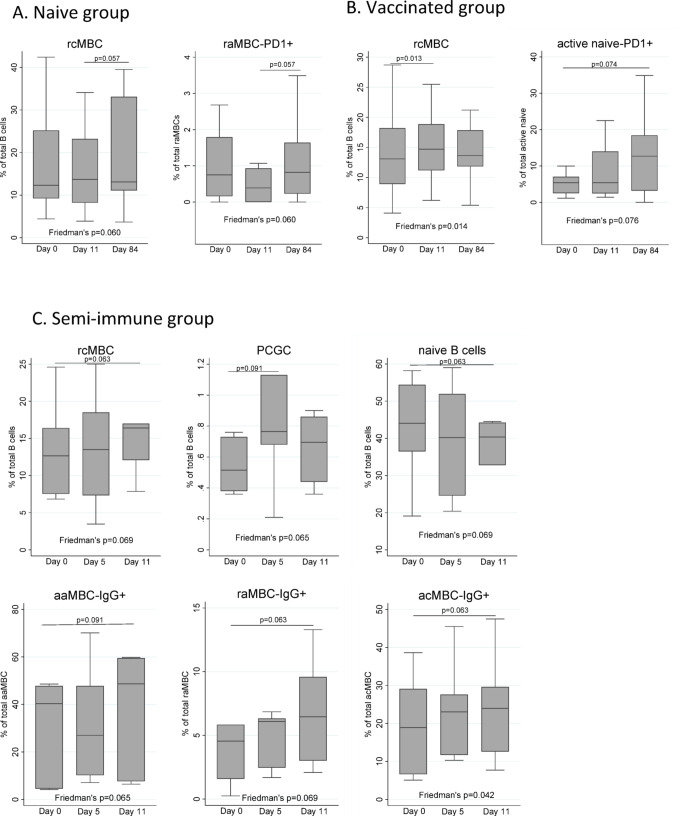
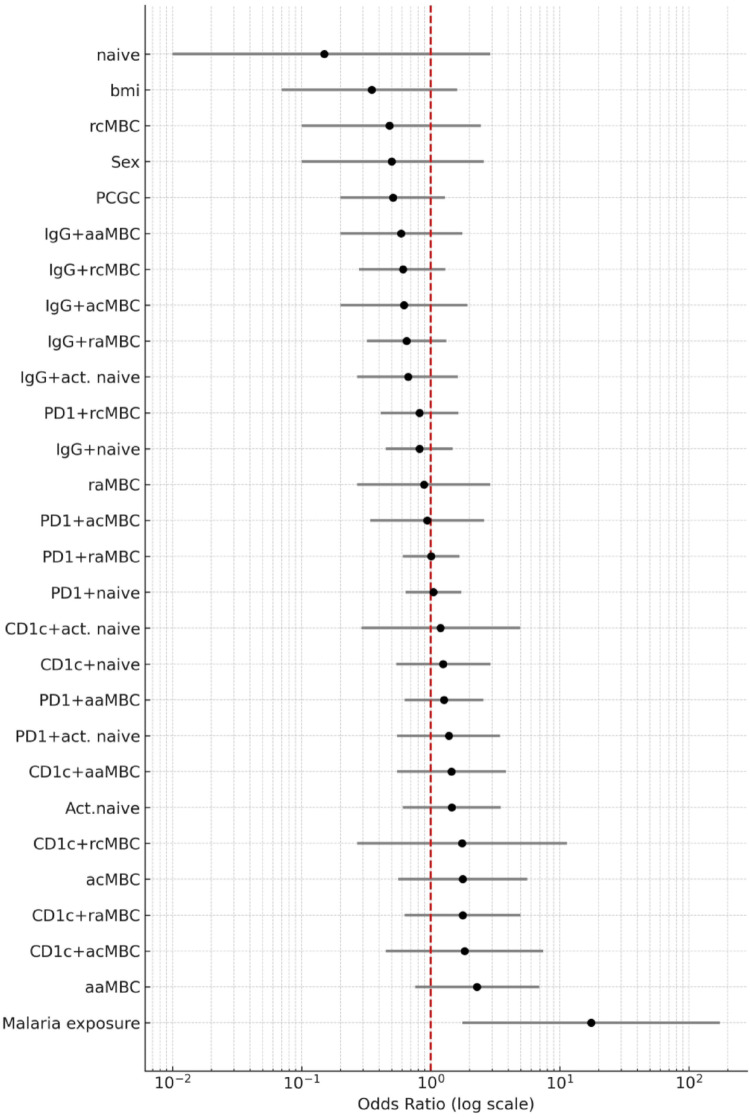
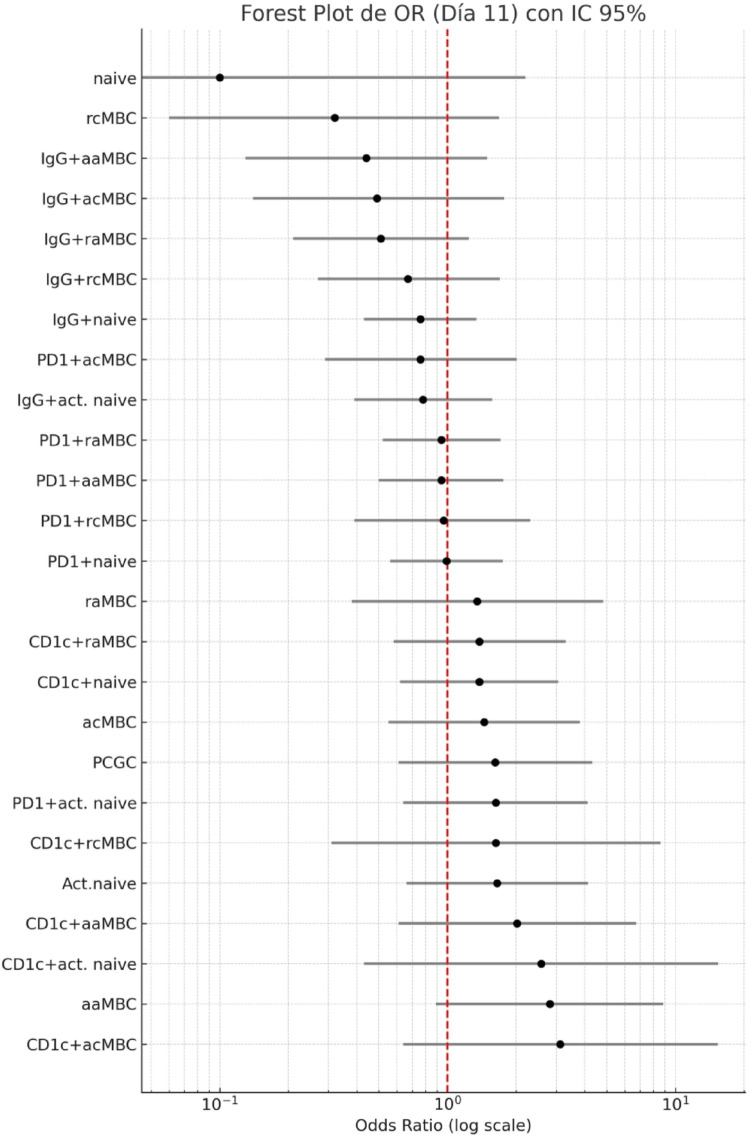
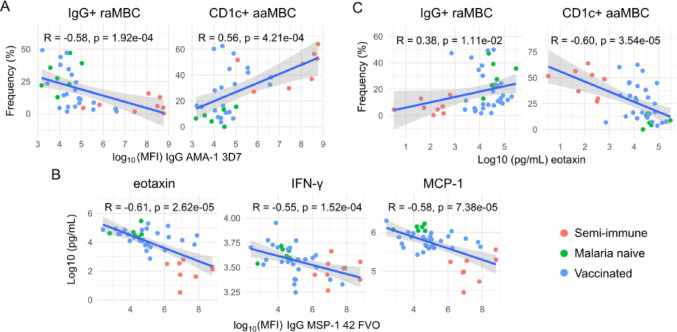
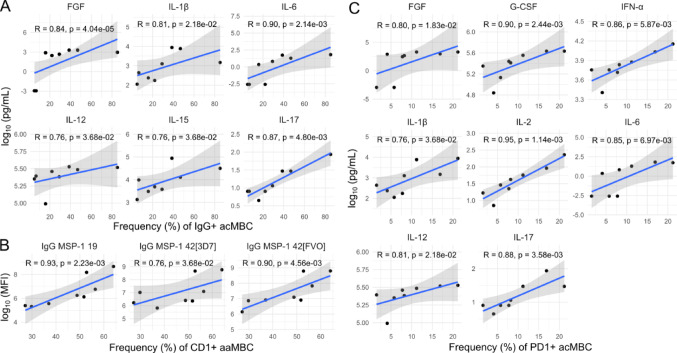
Continuous exposure to Plasmodium falciparum (Pf) has been associated with alterations in B cells. We investigated the effect of controlled human malaria infection (CHMI) on B cell phenotypes in individuals with different Pf immunity status: malaria-naïve, immunized with PfSPZ-CVac and semi-immune (lifelong-exposed) volunteers. Compared to naïve, semi-immune but not vaccinated individuals, had increased baseline frequencies of immature B cells (CD19+CD10+), active naive (IgD+CD27-CD21-) B cells, active atypical (IgD-CD27-CD21-) memory B cells (MBCs), active classical (IgD-CD27+CD21-) MBCs and CD1c+-B cells but lower frequencies of some IgG+-B cells. The frequencies of CD1c+ active atypical MBCs correlated positively with anti-Pf antibodies and negatively with circulating eotaxin levels, while the opposite was observed for IgG+ resting atypical MBCs. During early blood-stage infection (day 11 after CHMI), there was an expansion of resting classical (IgD-CD27+CD21+) MBCs in all three groups. Vaccination, compared to placebo, altered the effect of CHMI on B cells, showing a positive association with resting classical MBCs (β = 0.190, 95% CI 0.011-0.368) and active naïve-PD1+ (β = 0.637, 95% CI 0.058 to 1.217) frequencies, and a negative one with CD1c+ resting atypical MBCs (β = - 0.328, 95% CI - 0.621 to - 0.032). In addition, the sickle cell trait in semi-immune subjects altered the effect of CHMI on several B cells. In conclusion, lifelong but not vaccine exposure to malaria was associated with increased frequencies of multiple B cell subsets, with higher and lower percentages of CD1c and IgG expressing-cells, respectively. A single infection (CHMI) induces changes in B cell frequencies and is modulated by sickle cell trait and malaria-immunity status.Clinical Trials Registration NCT01624961, NCT02115516, and NCT02237586.

Keywords: Plasmodium falciparum; B cells; Controlled human malaria infection; Cytokines.


Conflict of interest statement

Declarations. Conflict of interest: E.R.J., B.K.L.S., and S.L.H. work for Sanaria Inc., a company that produces the Plasmodium falciparum sporozoite products used in the studies described in this manuscript. The authors have no financial or proprietary interests in any material discussed in this article.

Figures

Fig. 1
Fig. 1
Scheme of clinical trials. A Life-long exposed individuals trial (LACHMI-001). B Malaria naïve individuals clinical trial (TÜCHMI-001). C Malaria naïve PfSPZ-CVac vaccinated individuals trial (TÜCHMI-002). Days of blood sample collection for PBMC cryopreservation and subsequent B cell analysis are indicated
Fig. 2
Fig. 2
Gating strategy. Viable B cells (VBC) were gated based on CD19 + and DUMP- (DUMP channel included life/dead staining, CD3, CD14, and CD16); immature B cells were CD10 + and IgG- VBC; plasmablasts and germinal center cells were gated within the in VBC AND NOT immature cells (IgD and CD38++); switched VBC were gated within VBC AND NOT immature VBCs and were CD38+ (not high) and IgD; acMBCs abbreviates active classical memory B cells (MBCs) (Switched: CD21 CD27+); rcMBCs, resting classical MBCs (switched: CD21+CD27+); aaMBC, active atypical MBCs (switched: CD21CD27); raMBCs, resting atypical MBCs (switched: CD21+CD27); unswitched (VBC not immature VBCs, not CD38++ and IgD+); resting naïve (unswitched: CD21+CD27); active naïve (unswitched: CD21CD27)
Fig. 3
Fig. 3
Differences in frequencies of B cells between groups at baseline. Boxplots show, for the different study populations (naïve (n = 19), vaccinated (n = 21) and semi-immune individuals (n = 8)), A the baseline percentages of B cell populations, B the frequencies of active atypical memory B cells (aaMBCs) expressing the different markers, C the frequencies of resting atypical memory B cells (raMBCs) expressing the different markers. Outliers in the plot of PD1 + raMBC are excluded. The values for the remaining B cell populations expressing CD1c, PD1 and IgG are provided in the Supplementary Table 2. Median, and 25th and 75th percentiles (lower and upper hinge respectively) are represented as boxes. *p < 0.05, **p < 0.01, other p-values < 0.1 are reported with numbers. P-values correspond to Dunn’s test corrected for multiple comparisons with the Bonferroni method
Fig. 4
Fig. 4
Effect of CHMI on B cell subsets distribution. Boxplots show the percentages of selected B cell populations before (Day 0) and at different timepoints after the CHMI, in the categorized groups: A naive, B vaccinated, and C semi-immune individuals. Median, and 25th and 75th percentiles (lower and upper hinge respectively) are represented as boxes. Outside values are not displayed in the graphs. Differences between timepoints were assessed by Friedman’s test, followed by two-by-two comparisons corrected with Bonferroni’s test for multiple comparisons
Fig. 5
Fig. 5
Effect of vaccination status in the B cell distribution at different follow-up periods after CHMI. Mean cell subset frequencies plus standard error of the mean are represented for the different arms of the TÜCHMI-2 cohort over time. Only B cell populations with statistically significant interactions with vaccination are shown
Fig. 6
Fig. 6
Forest plot showing odds ratios (ORs) and corresponding 95% confidence intervals for the associations of the B cell frequencies and other variables measured baseline with malaria infection after CHMI. The ORs were estimated by means of individual logistic regressions with the samples from LACHMI-001 and the PfSPZ-CVac-vaccinated group (n = 29). The vertical red dashed line indicates the null value (OR = 1.0), representing no association with the outcome
Fig. 7
Fig. 7
Forest plot showing odds ratios (ORs) and corresponding 95% confidence intervals for the associations of the B cell frequencies at day 11 with malaria infection after CHMI. The ORs were estimated by means of individual logistic regressions with the samples from LACHMI and the PfSPZ-CVac-vaccinated group (n = 29). The vertical red dashed line indicates the null value (OR = 1.0), representing no association with the outcome
Fig. 8
Fig. 8
Significant correlations of B cell frequencies, P. falciparum IgG levels (surrogates of Pf exposure) and cytokine concentrations at baseline. Scatter plots of immune responses measured in semi-immune (LACHMI-001, red), vaccinated (TÜCHMI-002, blue dots) and naïve (TÜHMI-001, green) individuals together, with Spearman’s coefficients and raw p-values. A IgG to AMA-1 correlated negatively with IgG+ resting atypical memory B cells (raMBC) and positively with CD1c+ active atypical memory B cells (aaMBC). B Negative correlation of IgG to MSP142 vs. eotaxin, IFN-γ or MCP-1. C Eotaxin correlated negatively with CD1c+ aaMBC and positively with IgG+ raMBC
Fig. 9
Fig. 9
Significant correlations of B cell frequencies, P. falciparum IgG levels (surrogates of Pf exposure) and cytokine concentrations at baseline in semi-immune individuals. A Positive correlations of IgG+ MBC) vs. pro-inflammatory cytokines in semi-immune volunteers. B CD1c+ active atypical MBC (aaMBC) correlated positively with anti-PfMSP119 and anti-PfMSP142 IgG levels. C PD1+ active classical MBC (acMBC) correlated positively with pro-inflammatory cytokines. Full correlograms of all immune markers are shown in supplementary materials

Update of

References

    1. Geneva: World Health Organization. World malaria report 2024: addressing inequity in the global malaria response. [Internet]. Available from: https://www.wipo.int/amc/en/mediation/https://www.who.int/teams/global-malaria-programme/reports/world-malaria... (2024).
    1. RTS S Clinical Trials Partnership (2015) Efficacy and safety of RTS, S/AS01 malaria vaccine with or without a booster dose in infants and children in Africa: Final results of a phase 3, individually randomised, controlled trial. The Lancet 386:31–45 - PMC - PubMed
    1. Datoo MS, Natama HM, Somé A, Bellamy D, Traoré O, Rouamba T et al (2022) Efficacy and immunogenicity of R21/Matrix-M vaccine against clinical malaria after 2 years’ follow-up in children in Burkina Faso: a phase 1/2b randomised controlled trial. Lancet Infect Dis 22:1728–1736 - PubMed
    1. Mordmüller B, Surat G, Lagler H, Chakravarty S, Ishizuka AS, Lalremruata A, Gmeiner M, Campo JJ, Esen M, Ruben AJ, Held J (2017) Sterile protection against human malaria by chemoattenuated PfSPZ vaccine. Nature 542(7642):445–449 - PMC - PubMed
    1. Mwakingwe-Omari A, Healy SA, Lane J, Cook DM, Kalhori S, Wyatt C et al (2021) Two chemoattenuated PfSPZ malaria vaccines induce sterile hepatic immunity. Nature 595:289–294 - PMC - PubMed

Publication types

Associated data

LinkOut - more resources