. 2025 Jan-Dec;19(1):e70038.
doi: 10.1049/syb2.70038.

Integrative Analysis of TLS-Associated Gene Signatures, Immune Infiltration and Drug Sensitivity in Pancreatic Cancer

Affiliations

Integrative Analysis of TLS-Associated Gene Signatures, Immune Infiltration and Drug Sensitivity in Pancreatic Cancer

Mengzhou Gao et al. IET Syst Biol. 2025 Jan-Dec.

Abstract

Pancreatic adenocarcinoma (PAAD) remains highly lethal because of chemotherapy resistance and immunosuppressive microenvironments. Tertiary lymphoid structures (TLSs) were analysed in PAAD to develop personalised therapeutic strategies. Nine TLS-related genes (CCR6, CD1d, CD79B, CETP, EIF1AY, LAT, PTGDS, RBP5 and SKAP1) were selected for integrative analysis of TLS status in relation to clinical outcomes, immune cell infiltration, tumour mutational burden (TMB) and drug resistance. High TLS scores (TLS_H) were associated with improved overall survival (OS) and progression-free survival (PFS), independent of age or tumour grade. Twelve immune cell types differed across TLSs. Single-cell RNA-seq analysis revealed that the 9 TLS-related genes were enriched in distinct immune cell populations. Combining TLS and TMB improved survival prediction. Notably, the TLS_H group demonstrated enhanced sensitivity to chemotherapeutics including AZD8055, axitinib, vorinostat, nilotinib, camptothecin and paclitaxel. Real-time fluorescent quantitative PCR (RT-qPCR) validation in Mia PaCa2 and Jurkat cells indicated that LAT, RBP5 and SKAP1 may play important roles in modulating sensitivity to these chemotherapeutics. These findings establish TLS as a potential biomarker for PAAD, enabling personalised chemotherapy selection by integrating immune contexture and genomic drivers to improve clinical outcomes.

Keywords: bioinformatics; chemotherapy resistance; pancreatic cancer; tertiary lymphoid structures; tumour mutational burden.


Conflict of interest statement

The authors declare no conflicts of interest.

Figures

FIGURE 1
FIGURE 1
Flowchart of this study.
FIGURE 2
FIGURE 2
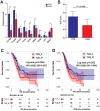
Correlation of the TLS signature with prognosis in patients with PAAD. (A) The expression levels of 9 TLS genes between PAAD and CTRL groups. (B) The distribution of TLS values between PAAD and CTRL groups. (C) KM plots of OS between TLS_H and TLS_L groups in patients with PAAD. (D) KM plots of PFS between TLS_H and TLS_L groups in patients with PAAD. *0.01 ≤ p < 0.05, **0.001 ≤ p < 0.01, ***p < 0.001.
FIGURE 3
FIGURE 3
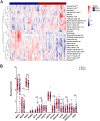
Correlation between TLS signature and immune microenvironment. (A) Heat map displaying of the distribution of various immune cells in patients with TLS_H and TLS_L; (B) Distribution of the expression levels of immune checkpoint genes in patients with TLS_H and TLS_L. *0.01 ≤ p < 0.05, **0.001 ≤ p < 0.01 and ***p < 0.001.
FIGURE 4
FIGURE 4
Distribution of the 9 TLS‐related genes in single cells of PDAC. (A) Expression distribution of CCR6. (B) Expression distribution of CD1d. (C) Expression distribution of CD79B. (D) Expression distribution of CETP. (E) Expression distribution of EIF1AY. (F) Expression distribution of LAT. (G) Expression distribution of PTGDS. (H) Expression distribution of RBP5. (I) Expression distribution of SKAP1.(J) Fifteen cell clusters of PDAC. (K) Dot plot showing cell‐type‐specific expression of 9 TLS‐related genes in adjacent noncancerous pancreatic tissue (ADJ) and PDAC.
FIGURE 5
FIGURE 5
Kaplan–Meier plots comparing the survival of TLS_H&TMB_H, TLS_H&TMB_L, TLS_L&TMB_H and TLS_L&TMB_L groups. (A) Correlation of TLS and TMB status with OS. (B) Correlation of TLS and TMB status with PFS.
FIGURE 6
FIGURE 6
Immune checkpoint genes with differential distributions across subgroups of diverse TLS and TMB statuses.
FIGURE 7
FIGURE 7
Plots of clinical prognostic correlation between top four high‐frequency mutations and unmutated samples. (A) TP53, (B) KRAS, (C) CDKN2A and (D) SMAD4.
FIGURE 8
FIGURE 8
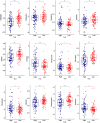
The IC50 values of 12 chemotherapeutic agents across different TLS status groups. *0.01 ≤ p < 0.05, **0.001 ≤ p < 0.01 and ***p < 0.001.
FIGURE 9
FIGURE 9
The expression of TLS genes in Mia PaCa2 and Jurkat cells treated with chemotherapeutic agents; *0.01 ≤ p < 0.05, **0.001 ≤ p < 0.01, ***p < 0.001 and ****p < 0.0001.

References

    1. Maddipati R. and Stanger B. Z., “Pancreatic Cancer Metastases Harbor Evidence of Polyclonality,” Cancer Discovery 5, no. 10 (2015): 1086–1097, 10.1158/2159-8290.cd-15-0120. - DOI - PMC - PubMed
    1. Neoptolemos J. P., Kleeff J., Michl P., Costello E., Greenhalf W., and Palmer D. H., “Therapeutic Developments in Pancreatic Cancer: Current and Future Perspectives,” Nature Reviews Gastroenterology & Hepatology 15, no. 6 (2018): 333–348, 10.1038/s41575-018-0005-x. - DOI - PubMed
    1. Halbrook C. J., Lyssiotis C. A., Pasca Di Magliano M., and Maitra A., “Pancreatic Cancer: Advances and Challenges,” Cell 186, no. 8 (2023): 1729–1754, 10.1016/j.cell.2023.02.014. - DOI - PMC - PubMed
    1. Schumacher T. N. and Thommen D. S., “Tertiary Lymphoid Structures in Cancer,” Science 375, no. 6576 (2022): eabf9419, 10.1126/science.abf9419. - DOI - PubMed
    1. Tanaka T., Masuda A., Inoue J., et al., “Integrated Analysis of Tertiary Lymphoid Structures in Relation to Tumor‐Infiltrating Lymphocytes and Patient Survival in Pancreatic Ductal Adenocarcinoma,” Journal of Gastroenterology 58, no. 3 (2023): 277–291, 10.1007/s00535-022-01939-8. - DOI - PubMed

Publication types

MeSH terms

Substances