Detection of Immunity Gap before Measles Outbreak, Ho Chi Minh City, Vietnam, 2024

Thinh Ong et al. Emerg Infect Dis. 2025 Oct.

Abstract

In 2022, we established a residual sample serosurveillance program in Ho Chi Minh City, Vietnam. During September 2022-April 2024, we found low measles antibody seroprevalence in children in the city's western region, where a measles outbreak began in May 2024. Serosurveillance could be a useful tool for outbreak prediction and prevention.

Keywords: Measles; Vietnam; disease outbreaks; epidemiology; population surveillance; serology; viruses.


Figures

Figure 1
Figure 1
Hospital locations, catchment areas, and number of cases per age in detection of immunity gap before a measles outbreak, Ho Chi Minh City, Vietnam, 2024. A) Children’s Hospital 1; B) Children’s Hospital 2; C) City Children’s Hospital. The first column shows seroprevalence as a function of time of collection for 2 age bands from each hospital; blue rectangles indicate the latest collections; dashed red lines represent the 95% critical vaccination threshold for measles; tick marks at top and bottom of graphs denote seropositive and negative samples; points represent monthly aggregated seroprevalence; error bars indicate 95% CI of the aggregated seroprevalence; shaded areas indicate 95% CI of the seroprevalence estimates by time of collection. Before the measles outbreak, the levels of seroprevalences were 70.7% (95% CI 57.6–81.1) for Children’s Hospital 1 in April 2024 (A), 58.1% (95% CI 44.1–70.9) for Children’s Hospital 2 in December 2023 (B), and 41.5% (95% CI 29.4–54.1) for City Children’s Hospital in December 2023 (C). The middle column shows age-stratified seroprevalence at the most recent timepoint (represented in blue rectangles from the first column). The third column maps the catchment areas based on sample addresses.
Figure 2
Figure 2
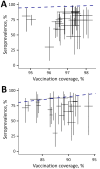
Comparison of seroprevalence and vaccination coverage in a study of immunity gap before a measles outbreak, Ho Chi Minh City, Vietnam, 2024. A) Seroprevalence among children receiving first measles vaccine dose only; B) seroprevalence among children receiving first and second measles vaccine doses. Bars show the 95% CI of seroprevalence (vertical) and vaccine coverage (horizontal). Seroprevalence remained below the administrative vaccination coverage estimates for children who received both first and second measles doses but corresponded more closely with second-dose coverage. The blue dashed line indicates 1:1 relationship of vaccination coverage to seroprevalence. A wider view, administrative coverage data for each district and neighboring provinces, and antibody concentration of 17 children <9 months of age is available in the Appendix.

References

    1. Metcalf CJE, Farrar J, Cutts FT, Basta NE, Graham AL, Lessler J, et al. Use of serological surveys to generate key insights into the changing global landscape of infectious disease. Lancet. 2016;388:728–30. 10.1016/S0140-6736(16)30164-7 - DOI - PMC - PubMed
    1. Diggle PJ. Estimating prevalence using an imperfect test. Epidemiol Res Int. 2011;2011:608719. 10.1155/2011/608719 - DOI
    1. Cori A, Ferguson NM, Fraser C, Cauchemez S. A new framework and software to estimate time-varying reproduction numbers during epidemics. Am J Epidemiol. 2013;178:1505–12. 10.1093/aje/kwt133 - DOI - PMC - PubMed
    1. Worden L, Ackley SF, Zipprich J, Harriman K, Enanoria WTA, Wannier R, et al. Measles transmission during a large outbreak in California. Epidemics. 2020;30:100375. 10.1016/j.epidem.2019.100375 - DOI - PMC - PubMed
    1. Prem K, Zandvoort KV, Klepac P, Eggo RM, Davies NG, Cook AR, et al. ; Centre for the Mathematical Modelling of Infectious Diseases COVID-19 Working Group. Projecting contact matrices in 177 geographical regions: An update and comparison with empirical data for the COVID-19 era. PLoS Comput Biol. 2021;17:e1009098. 10.1371/journal.pcbi.1009098 - DOI - PMC - PubMed

Publication types

LinkOut - more resources