[Preprint]. 2025 Sep 12:2025.09.09.25335109.
doi: 10.1101/2025.09.09.25335109.

Panorama of Chromosomal Instability in Lung Cancer

Yang Yang  1 Xiaoming Zhong  1 William Phillips  1 Wei Zhao  2 Phuc H Hoang  2 Christopher Wirth  3 Soo-Ryum Yang  4 Charles Leduc  5 Marina K Baine  4 William D Travis  4 Lynette M Sholl  6 Philippe Joubert  7 Robert Homer  8 Jian Sang  2 Azhar Khandekar  2 John P McElderry  2 Thi-Van-Trinh Tran  2 Caleb Hartman  2 Mona Miraftab  2 Monjoy Saha  2 Olivia W Lee  2 Sunandini Sharma  2 Kristine M Jones  2 Bin Zhu  2 Marcos Díaz-Gay  9 Eric S Edell  10 Jacobo Martínez Santamaría  11 Matthew B Schabath  12 Sai S Yendamuri  13 Marta Manczuk  14 Jolanta Lissowska  14 Beata Świątkowska  15 Anush Mukeria  16 Oxana Shangina  16 David Zaridze  16 Ivana Holcatova  17   18 Vladimir Janout  19 Dana Mates  20 Simona Ognjanovic  21 Milan Savic  22 Milica Kontic  23 Yohan Bossé  7 Bonnie E Gould Rothberg  24 David C Christiani  25   26 Valerie Gaborieau  27 Paul Brennan  27 Geoffrey Liu  28 Paul Hofman  29 Maria Pik Wong  30 Kin Chung Leung  31 Chih-Yi Chen  32   33 Chao Agnes Hsiung  34 Angela C Pesatori  35   36 Dario Consonni  36 Nathaniel Rothman  2 Qing Lan  2 Martin A Nowak  37   38 David C Wedge  3 Ludmil B Alexandrov  39   40   41   42 Stephen J Chanock  2 Jianxin Shi  2 Tongwu Zhang  2 Lixing Yang  1   43   44 Maria Teresa Landi  2
Affiliations

Panorama of Chromosomal Instability in Lung Cancer

Yang Yang et al. medRxiv. .

Abstract

Lung cancer is a highly heterogeneous disease primarily driven by tobacco smoking. About 20% of lung cancers occur among patients who have never smoked (LCINS) with differences in patient ancestry, sex, tumor histology, and clinical features. Our understanding of chromosomal instability in lung cancer, especially LCINS, is still limited. Here, we perform a comprehensive study of 182,429 somatic structural variations (SVs) detected in 1,209 whole-genome sequenced lung cancers, of which 864 LCINS. SVs are more abundant in tumors from patients who have smoked (LCSS); however, they are more complex and play more important roles in tumorigenesis in LCINS. EGFR mutations and KRAS mutations profoundly and independently shape the SV landscape. EGFR-mutant tumors have higher SV burden and more cancer-driving SVs. In contrast, KRAS mutations are associated with lower SV burden and less driver SVs. We decompose 16 SV signatures for both complex and simple SVs that likely represent divergent molecular mechanisms. The SV breakpoints have distinct distributions across the genome depending on the signatures due to mutagenic mechanisms and positive selection. Many established cancer-driving genes are recurrently rearranged by multiple SV signatures suggesting functional convergence of these genome instability mechanisms.


Conflict of interest statement

Disclosure L.B.A. and M.D-G. declare a European patent application with application number EP25305077.7. All other authors have no competing interests to declare. L.B.A. is a co-founder, CSO, scientific advisory member, and consultant for io9, has equity and receives income. The terms of this arrangement have been reviewed and approved by the University of California, San Diego in accordance with its conflict of interest policies. L.B.A. is also a compensated member of the scientific advisory board of Inocras. L.B.A.’s spouse is an employee of Biotheranostics. E.N.B. and L.B.A. declare U.S. provisional patent application filed with UCSD with serial numbers 63/269,033. LBA also declares U.S. provisional applications filed with UCSD with serial numbers: 63/366,392; 63/289,601; 63/483,237; 63/412,835; and 63/492,348. L.B.A. is also an inventor of a US Patent 10,776,718 for source identification by non-negative matrix factorization. L.B.A. and M.D-G. further declare a European patent application with application number EP25305077.7. S.R.Y. has received consulting fees from AstraZeneca, Sanofi, Amgen, AbbVie, and Sanofi; received speaking fees from AstraZeneca, Medscape, PRIME Education, and Medical Learning Institute. All other authors declare that they have no competing interests.

Figures

Figure 1.
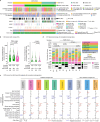
Figure 1.. Landscape of somatic SVs in 1,209 whole-genome sequenced lung cancers.
a, Sankey diagram illustrates the relationships among ancestry, sex, self-reported smoking status and tumor histology type in our cohort of 1,209 lung cancers. The vertical bars represent four categories (ancestry, sex, smoking and tumor type). The height of each bar is proportional to the number of patients/tumors in each category. The connecting bands represent the flow of patients/tumors from one category to another. The thickness of each link is proportional to the number of patients/tumors transitioning between the connected nodes. b, SV burden and composition across tumor types. The black dots on the top panel depict the number of somatic SVs detected in each tumor grouped by tumor type. Red lines indicate the median numbers of SVs, while blue dashed lines indicate the interquartile range (IQR) boundaries (Q1 and Q3). Two-sided Wilcoxon rank-sum test with False Discovery Rates (FDR) correction is used to compare SV burdens across tumor types (excluding “Others”), with only FDRs < 0.05 shown. The lower panel shows the composition of SVs, including clustered complex SVs, non-clustered complex SVs and simple SVs. c, SV burden in LCINS and LCSS. Box plots within violins indicate the interquartile ranges and medians. A two-sided Wilcoxon rank-sum test is used to calculate the P value. d, e and f, Examples of clustered complex SVs (d), non-clustered complex SVs (e) and simple SVs (f). Colored arcs represent SVs of different types. Red bars beneath the arcs in (d) mark the regions of clustered complex SVs. The copy number profiles are shown as black bars above the chromosome models. Centromere positions are highlighted as red bars within the grey chromosome ideograms. Sample IDs are displayed next to the corresponding SV signatures, and specific SV signatures/types are labeled for each example (e.g., 1 ecDNA/HSR, chromoplexy, deletion, etc.).
Figure 2.
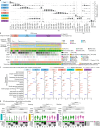
Figure 2.. Clustered and non-clustered complex SVs.
a, Overview of complex SVs in 1,209 tumors. The thin bars along the x-axis of each track represent individual tumors. For the 3rd and 4th signature tracks, the numbers in parentheses indicate the number of tumors with a unique complex SV signature of that type, while the “Multiple” groups in clustered and non-clustered complex SVs represent tumors with multiple complex SVs of different signatures. Therefore, numbers in parentheses may be smaller than those reported in the text, which include all tumors carrying that signature regardless of whether they have other complex SV signatures. b, Comparison of the numbers of breakpoints per clustered (left) and non-clustered (right) complex SV events across ancestry and smoking status, where n indicates the number of tumors in each group. Box plots within violins indicate the interquartile ranges and medians. Statistical comparisons are performed using two-sided Wilcoxon rank-sum tests with FDR correction; only FDRs < 0.05 are shown. c, Factors associated with clustered and non-clustered complex SV signatures using logistic regression. Odds ratios (ORs) are presented for significant factors in corresponding signatures. Error bars represent 95% confidence intervals. SCNA subtypes, piano (few SCNAs), mezzo-forte (enriched with arm-level amplification) and forte (dominated by whole-genome duplication), are defined according to our previous study. d, Distributions of clustered complex SV signatures across tumors in selected groups. Each vertical column in the middle represents a tumor group defined by smoking status and mutation status of TP53, EGFR and KRAS in the bottom blocks. Each horizontal bar within a column in the middle represents one tumor. The height of each tumor may vary depending on the number of tumors (n) of the group. Tumors are color-coded based on clustered complex SV signatures with tumors exhibiting multiple SV signatures shown as horizontally segmented bars with different colors. Pairwise comparisons are performed for all clustered complex SVs combined between groups differing by only one factor using Fisher’s exact test with FDR correction; only FDRs < 0.05 are shown.
Figure 3.
Figure 3.. Simple SV signatures.
a, Eight simple SV signatures detected in 1,209 tumors. The 49 SV categories used for signature extraction are shown on the x-axis. The eight simple SV signatures are shown on the left side of the y-axis. The height of each bar represents the proportion of SVs assigned to the corresponding signature. b, Five clusters of tumors based on the simple SV signatures (excluding tumors lacking simple SVs). Vertical lines represent individual tumors. c, Factors associated with simple SV signatures. ORs are presented for significant factors. Error bars represent 95% confidence intervals. d, Comparisons of simple SV signatures across selected groups. The violin plots illustrate the distributions of numbers of simple SVs for “Fb inv” signature on the left, “Intra tra” signature in the middle, and “Inter tra” signature on the right. Box plots within violins indicate the interquartile ranges and medians. Tumor group is defined by smoking status and mutation status of TP53, EGFR and KRAS in the bottom blocks. Statistical comparisons are performed between groups differing by only one factor using two-sided Wilcoxon rank-sum tests with FDR correction; only FDRs < 0.05 are shown.
Figure 4.
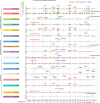
Figure 4.. Genome-wide SV breakpoint distribution for each SV signature.
Chromosomal structures are represented by grey bars at the bottom with red lines marking centromeres. Each vertical bar represents the percentage of tumors carrying SV breakpoints for a specific SV signature in the corresponding 1 Mb interval. Known oncogenes, tumor suppressors, fragile sites and L1 retrotransposition events are annotated in major peaks.
Figure 5.
Figure 5.. Cancer-driving mutations/indels and SVs.
a, Proportions of tumors harboring mutations/indels and SVs in known cancer driver genes in LCINS and LCSS. “*”s that are in or above the green bars and in or below the pink bars represent alterations significantly enriched in LCINS and LCSS, respectively. Enrichment is assessed using Fisher’s exact test with FDR correction. b, Factors associated with the number of driver genes altered by mutations/indels (left) and by SVs (right). ORs are presented for significant factors. Error bars represent 95% confidence intervals. c, Numbers of driver genes altered by mutations/indels (left) and by SVs (right) across selected groups. Box plots within violins indicate the interquartile ranges and medians. Statistical comparisons are performed using two-sided Wilcoxon rank-sum tests with FDR correction; only FDRs < 0.05 are shown. d, SV signature composition of focal gains and losses in known cancer driver genes in LCINS (top) and LCSS (bottom). Colored bars represent SV types (left) and signatures (right). Enrichment of SV types or signatures comparing LCINS and LCSS is tested using Fisher’s exact test with FDR correction. Significantly enriched SV types and signatures are marked with black outlines.
Figure 6.
Figure 6.. EGFR-associated SVs in LCINS and LCSS.
a, Oncoprint plot showing EGFR focal gains and mutations/indels. b, Examples of SV signatures driving EGFR focal gains. Colored arcs represent SVs of different types. Red bars beneath the arcs mark the regions of clustered complex SVs. The copy number profiles are shown as black bars above the chromosome models. Centromere positions and EGFR genes are highlighted as red bars and black boxes within the grey chromosome ideograms. Sample IDs are displayed next to the corresponding SV signatures. EGFR copy number (CN), tumor purity, and mutant allele fraction (MAF) are listed for the cases with EGFR point mutations/indels.

References

    1. Siegel R. L., Miller K. D. & Jemal A. Cancer statistics, 2018. CA Cancer J Clin 68, 7–30 (2018). 10.3322/caac.21442 - DOI - PubMed
    1. Couraud S., Zalcman G., Milleron B., Morin F. & Souquet P. J. Lung cancer in never smokers--a review. Eur J Cancer 48, 1299–1311 (2012). 10.1016/j.ejca.2012.03.007 - DOI - PubMed
    1. Wakelee H. A. et al. Lung cancer incidence in never smokers. J Clin Oncol 25, 472–478 (2007). 10.1200/JCO.2006.07.2983 - DOI - PMC - PubMed
    1. Boffetta P. et al. Multicenter case-control study of exposure to environmental tobacco smoke and lung cancer in Europe. J Natl Cancer Inst 90, 1440–1450 (1998). 10.1093/jnci/90.19.1440 - DOI - PubMed
    1. Brownson R. C., Alavanja M. C., Caporaso N., Simoes E. J. & Chang J. C. Epidemiology and prevention of lung cancer in nonsmokers. Epidemiol Rev 20, 218–236 (1998). 10.1093/oxfordjournals.epirev.a017982 - DOI - PubMed

Publication types