

A workflow to discover partial differential equations from data: Application to the dynamics of tree biomass
- PMID: 41018247
- PMCID: PMC12464683
- DOI: 10.1016/j.mex.2025.103560
A workflow to discover partial differential equations from data: Application to the dynamics of tree biomass
Abstract
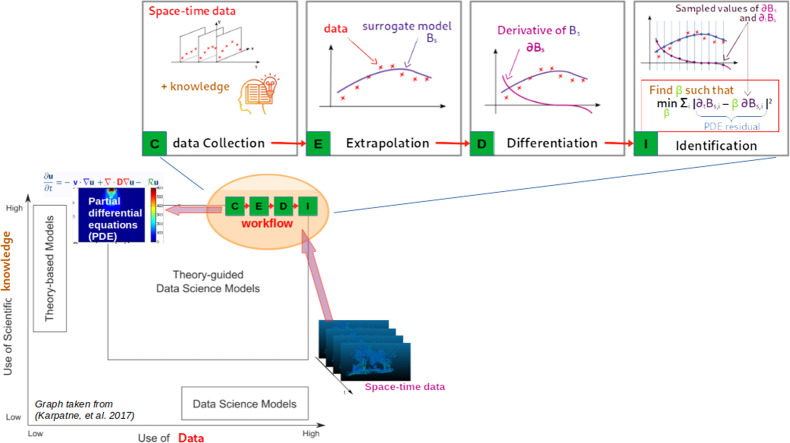
Mixed data and theory driven methods are promising approaches that can be used to bring better understanding of complex dynamics in life sciences. For vegetation growth, integrated knowledge may be lacking to design theoretical models like partial differential equations (PDE). This lack can be complemented by using data. The method presented in this paper is a generic computational workflow called CEDI that aims at discovering PDE models from data. As an illustration, we tested the workflow on biomass dynamics of three different 3D trees of specific architectural types. ● The name CEDI represents the four steps composing the workflow: data Collection, Extrapolation, Differentiation and Identification. ● The originality of this workflow is twofold: first, it encompasses the whole modeling process from the definition of the variables to the design of a PDE, and second it has been designed to be generic in a sense that it can apply to any dynamics and it covers most existing data driven PDE discovering methods. ● The workflow offers a framework to better understand data driven PDE discovering methods and a tool for modeling any dynamics, provided that right data and knowledge and also good algorithm settings are available.
Keywords: Data-driven modelling of plants; Parameter estimation; Physics informed neural network; Theory-guided data model.
© 2025 The Author(s).
Conflict of interest statement
The authors declare that they have no known competing financial interests or personal relationships that could have appeared to influence the work reported in this paper.
Figures


References
-
- Barczi J.-F. Plant Growth Simulation Data. CIRAD Dataverse. 2025;V1, doi: 10.18167/DVN1/VK0J16. - DOI
-
- Berg J., Nyström K. Data-driven discovery of PDEs in complex datasets. J. Comput. Phys. 2019;384:239–252. doi: 10.1016/j.jcp.2019.01.036. - DOI
-
- Bonneu A., Dumont Y., Rey H., Jourdan C., Fourcaud T. A minimal continuous model for simulating growth and development of plant root systems. Plant Soil. 2012;354:211–227. doi: 10.1007/s11104-011-1057-7. - DOI
LinkOut - more resources
Full Text Sources
Research Materials
