. 2025 Sep 11;47(9):747.
doi: 10.3390/cimb47090747.

Integration of eQTL and GEO Datasets to Identify Genes Associated with Breast Ductal Carcinoma In Situ

Affiliations

Integration of eQTL and GEO Datasets to Identify Genes Associated with Breast Ductal Carcinoma In Situ

Cai-Qin Mo et al. Curr Issues Mol Biol. .

Abstract

Background: Breast ductal carcinoma in situ (DCIS), a common precursor of breast cancer, has poorly understood susceptible driver genes. This study aimed to identify genes influencing DCIS progression by integrating Mendelian randomization (MR) and Gene Expression Omnibus (GEO) datasets.

Methods: The GEO database was searched for DCIS-related datasets to extract differentially expressed genes (DEGs). MR was employed to find exposure single-nucleotide polymorphisms (SNPs) of expression quantitative trait locus (eQTL) gene expression from Genome-Wide Association Study database (GWAS) (IEU openGWAS project). DCIS was designated as the outcome variable. The intersection of genes was used for GO, KEGG and CIBERSORT analyses. The functional validation of selected DEGs was performed using Transwell invasion assays.

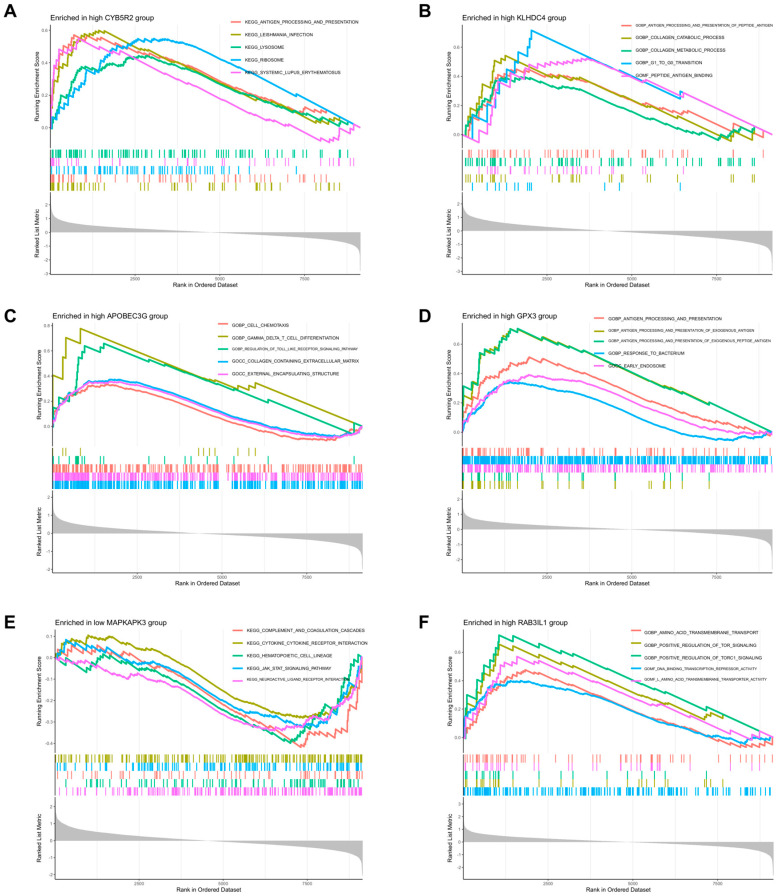
Results: Four datasets (GSE7782, GSE16873, GSE21422, and GSE59246) and 19,943 eQTL exposure data were obtained from GEO and the IEU openGWAS project, respectively. By intersecting DEGs, 13 genes (LGALS8, PTPN12, YTHDC2, RNGTT, CYB5R2, KLHDC4, APOBEC3G, GPX3, RASA3, TSPAN4, MAPKAPK3, ZFP37, and RAB3IL1) were incorporated into subsequent KEGG and GO analyses. Functional assays confirmed that silencing PTPN12, YTHDC2 and MAPKAPK3, or overexpressing GPX3, RASA3 and TSPAN4, significantly suppressed DCIS cell invasion. These DEGs were linked to immune functions, such as antigen processing and presentation and the tumor microenvironment (TME), and they showed associations with dendritic cell activation differences.

Conclusions: Thirteen genes were associated with DCIS progression, and six genes were validated in the cell experiments. KEGG and GO analyses highlight TME's role in early breast cancer, enhancing understanding of DCIS occurrence and aiding identification of high-risk tumors.

Keywords: Mendelian randomization; differentially expressed genes; ductal carcinoma in situ; gene function prediction; tumor microenvironment.


Conflict of interest statement

The authors declare no conflicts of interest.

Figures

Figure 1
Figure 1
Experimental design of GEO combined with the Mendelian randomization study on differentially expressed genes in DCIS.
Figure 2
Figure 2
(A) Heatmap showing differentially expressed genes (DEGs) between ductal carcinoma in situ (DCIS) and normal breast tissue. (B) Plot of DEGs between DCIS and normal breast tissue. (C) Number of overlapping upregulated DEGs. (D) Number of overlapping downregulated DEGs.
Figure 3
Figure 3
(A) Forest plot differentially expressed genes (DEGs) from Mendelian randomization (MR) analysis. (B) Chromosomal positions of each DEG.
Figure 4
Figure 4
(A) Results of gene ontology (GO) enrichment analysis. (B) Results of Kyoto Encyclopedia of Genes and Genomes (KEGG) enrichment analysis. (C) Visualization of enrichment results and gene counts.
Figure 5
Figure 5
(AD) Gene Set Enrichment Analysis (GSEA) results for upregulated differentially expressed genes (DEGs) associated with immune cell infiltration. Additional details are provided in Supplementary Figure S2.
Figure 6
Figure 6
(AF) Gene Set Enrichment Analysis (GSEA) results for downregulated differentially expressed genes (DEGs) associated with immune cell infiltration. Additional details are provided in Supplementary Figure S2.
Figure 7
Figure 7
(A) Relationship between differentially expressed genes (DEGs) and various immune cell populations (green lines indicate negative regulation, red lines indicate positive regulation; line thickness correlates with the strength of the relationship). (B) Differences in immune cell abundance between the DCIS group and normal breast tissue group (* p < 0.05). (C) Heatmaps showing immune cell infiltration across different groups.
Figure 8
Figure 8
Differential expression of differentially expressed genes (DEGs) between the validation cohorts. Blue for normal tissue, red for DCIS (ductal carcinoma in situ) tissue. * p < 0.05, ** p < 0.01.
Figure 9
Figure 9
Upregulated differentially expressed genes (DEGs) in the Human Protein Atlas (HPA). (A) LGALS8; (B) PTPN12; (C) YTHDC2.
Figure 10
Figure 10
Downregulated differentially expressed genes (DEGs) in the Human Protein Atlas (HPA). (A) APOBEC3G; (B) CYB5R2; (C) GPX3; (D) KLHDC4; (E) RAB3IL1.
Figure 11
Figure 11
Effects of silencing PTPN12, YTHDC2, and MAPKAPK3 and overexpressing GPX3, RASA3, and TSPAN4 on DCIS cell invasion, determined using Transwell invasion assays. (A) Representative images of Transwell assays for DCIS-1 and DCIS-2 cells under different genetic manipulation conditions, scale bar, 50 μm.; (B) qRT-PCR results confirming s efficiency and overexpression levels; (C,D) Quantitative counts of invasive DCIS-1 (C) and DCIS-2 (D) cells from Transwell assays, respectively. Data are presented as mean ± SD. Statistical significance was assessed by one-way ANOVA; *** p < 0.001, ** p < 0.01, * p < 0.05. siRNA, small interfering RNA; wt, overexpressing type; DCIS, primary ductal carcinoma in situ cell.

References

    1. Van Seijen M., Lips E.H., Thompson A.M., Nik-Zainal S., Futreal A., Hwang E.S., Verschuur E., Lane J., Jonkers J., Rea D.W., et al. Ductal carcinoma in situ: To treat or not to treat, that is the question. Br. J. Cancer. 2019;121:285–292. doi: 10.1038/s41416-019-0478-6. - DOI - PMC - PubMed
    1. Welch H.G., Black W.C. Using autopsy series to estimate the disease “reservoir” for ductal carcinoma in situ of the breast: How much more breast cancer can we find. Ann. Intern. Med. 1997;127:1023–1028. doi: 10.7326/0003-4819-127-11-199712010-00014. - DOI - PubMed
    1. Sanders M.E., Schuyler P.A., Dupont W.D., Page D.L. The natural history of low-grade ductal carcinoma in situ of the breast in women treated by biopsy only revealed over 30 years of long-term follow-up. Cancer. 2005;103:2481–2484. doi: 10.1002/cncr.21069. - DOI - PubMed
    1. Fleischer T., Frigessi A., Johnson K.C., Edvardsen H., Touleimat N., Klajic J., Riis M.L., Haakensen V.D., Wärnberg F., Naume B., et al. Genome-wide DNA methylation profiles in progression to in situ and invasive carcinoma of the breast with impact on gene transcription and prognosis. Genome Biol. 2014;15:435. - PMC - PubMed
    1. Zhou W., Liu G., Hung R.J., Haycock P.C., Aldrich M.C., Andrew A.S., Arnold S.M., Bickeböller H., Bojesen S.E., Brennan P., et al. Causal relationships between body mass index, smoking and lung cancer: Univariable and multivariable Mendelian randomization. Int. J. Cancer. 2021;148:1077–1086. doi: 10.1002/ijc.33292. - DOI - PMC - PubMed

LinkOut - more resources