. 2025 Sep 11;47(9):748.
doi: 10.3390/cimb47090748.

Resina Draconis Promotes Diabetic Wound Healing by Regulating the AGE-RAGE Pathway to Modulate Macrophage Polarization

Affiliations

Resina Draconis Promotes Diabetic Wound Healing by Regulating the AGE-RAGE Pathway to Modulate Macrophage Polarization

Xin Jin et al. Curr Issues Mol Biol. .

Abstract

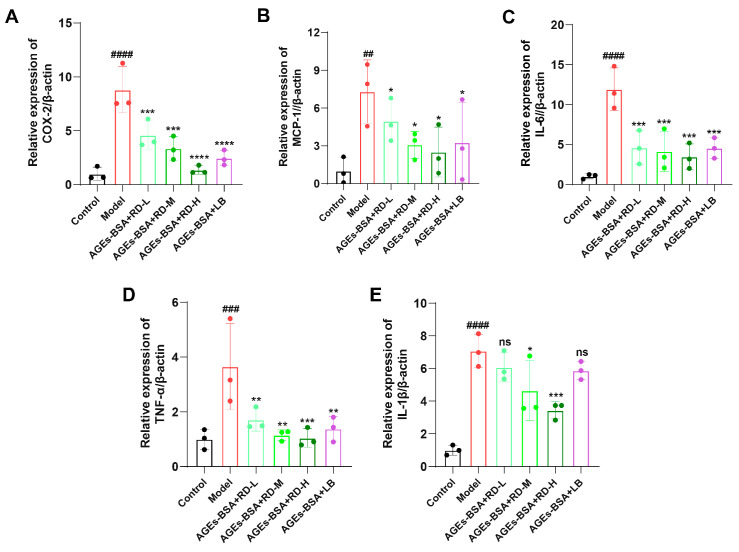
Resina Draconis (RD), a traditional Chinese medicine, has been widely used in treating diabetic foot ulcers. However, its specific mechanisms of action remain incompletely understood. First, network pharmacology combined with GEO clinical sample data mining was employed to systematically analyze the therapeutic targets of RD in promoting diabetic wound healing. Second, an AGEs-induced RAW264.7 cell model was utilized to investigate the regulatory effects of RD and its primary active components on the AGE-RAGE signaling pathway, along with their anti-inflammatory and antioxidant activities. Finally, a diabetic wound mouse model was established to validate the efficacy of RD and further explore its underlying molecular mechanisms. Integrated analysis of network pharmacology and GEO database mining identified 492 potential therapeutic targets of RD in diabetic wound healing, primarily involving the AGE-RAGE pathway. In vitro, RD (6.25 μg/mL) significantly suppressed AGE-induced inflammatory factors and ROS production while downregulating AGE-triggered RAGE protein overexpression. In vivo, RD hydrogel accelerated diabetic wound healing by modulating the AGE-RAGE axis and regulating macrophage polarization. RD effectively promotes diabetic wound healing through synergistic regulation of the AGE-RAGE pathway, oxidative stress suppression, and macrophage polarization modulation, providing a novel therapeutic strategy for diabetic wound management.

Keywords: AGE-RAGE; Resina Draconis; diabetic wound; macrophage polarization.


Conflict of interest statement

The authors declare no conflicts of interest.

Figures

Figure 1
Figure 1
Mechanism prediction of RD in promoting diabetic wound healing: (A) Venn diagram of RD components and DW targets. (B) Protein–protein interaction network of 42 effective targets. (C) Bubble chart of KEGG enrichment analysis for target genes. (D) Bar graph of GO enrichment analysis for target genes.
Figure 2
Figure 2
Bioinformatics analysis of clinical samples from the GSE29221 dataset: (A) Volcano plot displays differentially expressed genes (DEGs) with statistical significance. (B) Principal component analysis (PCA) demonstrates sample clustering based on gene expression profiles. (C) Hierarchical clustering heatmap illustrates expression patterns of key DEGs across samples. (D) KEGG pathway analysis reveals significantly enriched biological pathways among major DEGs. (E) Gene Ontology (GO) enrichment analysis identifies statistically significant functional terms in biological processes, molecular functions, and cellular components.
Figure 3
Figure 3
Molecular docking analysis of drug–target binding interactions: (A) Chemical structure of the main active components in RD. (B) Schematic diagram of the 3D structure of RAGE protein (3O3U) selected from the PDB database. (CH) Binding con-formations of RAGE protein with active ingredient ligands: (C) LA, (D) LB, (E) LC, (F) LD, (G) 7,4′-dihydroxyflavone (7,4′-DHF), and (H) resveratrol (RSV). The most stable conformation with the lowest binding energy was selected as the optimal binding mode for each compound.
Figure 4
Figure 4
Effects of AGEs-BSA, RD extract, and RD compounds on RAGE protein expression. (A,B) Relative RAGE protein levels in RAW264.7 cells, normalized to β-Tubulin as a loading control. (n = 3). Data were presented as mean ± standard deviation. ## p < 0.01, ### p < 0.001, vs. Control group; * p < 0.05, ** p < 0.01, *** p < 0.001, vs. model group; ns indicates no significant difference.
Figure 5
Figure 5
Quantification of inflammatory cytokine mRNA expression levels by qPCR. (AE) Effects of RD and LB on mRNA levels of COX-2, MCP-1, IL-6, TNF-α, and IL-1β in AGEs-BSA-treated RAW264.7 cells (n = 3). Data were presented as mean ± standard deviation. ## p < 0.01, ### p < 0.001, #### p < 0.0001, vs. Control group; * p < 0.05, ** p < 0.01, *** p < 0.001, **** p < 0.0001, vs. model group; ns indicates no significant difference.
Figure 6
Figure 6
Results of ROS generation assays: (A) Representative fluorescence images of ROS generation. (B) Measurement of ROS generation after intervention with different doses of RD and LB (n = 3). Data were presented as mean ± standard deviation. #### p < 0.0001, vs. Control group; ** p < 0.01, *** p < 0.001, **** p < 0.0001, vs. model group; ns indicates no significant difference.
Figure 7
Figure 7
Evaluation of RD and LB in promoting diabetic wound healing in vivo: (A) Schematic diagram of the diabetic wound healing experimental procedure. (B,C) Representative images and schematic diagrams of wound healing at days 0, 3, 5, 10, and 14 post-surgery for the Control group, model group, RD-H Gel group, RD-L Gel group, LB Gel group, and rb-bFGF Gel group under the same treatment conditions. (D) Wound area analysis using ImageJ software, normalized to the wound area on day 0 (n ≥ 6). (E) Representative HE staining results of skin wound sections on days 3 and 5 post-surgery (n = 3, scale bar: 0.2 mm). Black arrows indicate neo-epithelium (re-epithelialization). Red arrows indicate areas of inflammatory cell infiltration (predominantly neutrophils). Data were presented as mean ± standard deviation. ## p < 0.01, ### p < 0.001, vs. Control group; * p < 0.05, ** p < 0.01, *** p < 0.001, vs. model group.
Figure 8
Figure 8
Evaluation of RD and LB in promoting diabetic wound healing in vivo: (A) Representative HE and Masson staining results of skin wound sections on day 14 post-surgery. Black arrows indicate the fully regenerated epidermis (re-epithelialization). White arrows indicate dense and well-organized blue collagen fibers. (B,C) Quantitative analysis of neoepithelial thickness and collagen deposition (n = 3). Data were presented as mean ± standard deviation. #### p < 0.0001, vs. Control group; * p < 0.05, ** p < 0.01, *** p < 0.001, vs. model group.
Figure 9
Figure 9
Evaluation of the regulatory effects of RD and LB on the AGE-RAGE axis in vivo. (A) Immunohistochemical staining showing AGEs and RAGE expression (brownish-yellow indicates positive staining) in tissues from each group at Day 3/Day 5 (Scale bar: 0.05 mm). Black arrows indicate cells with intense brownish-yellow positive staining for AGEs/RAGE, primarily localized in the cytoplasm and cell membrane. (BE) Semi-quantification of immunohistochemical staining by positive area percentage (n = 3). ### p < 0.001, #### p < 0.0001 vs. Control group; * p < 0.05, ** p < 0.01, *** p < 0.001, **** p < 0.0001 vs. model group; ns indicates no significant difference.
Figure 10
Figure 10
Evaluation of the regulatory effects of RD and LB on macrophage polarization in vivo: (A) Immunofluorescence staining of iNOS+ (M1, red), CD68+ macrophages (green), and DAPI (blue) at day 5 (Scale bar: 50 μm). (B) Semi-quantitative analysis of M1 macrophages (CD68+iNOS+ cells). (C) Immunofluorescence staining of CD206+ (M2, red), CD68+ macrophages (green), and DAPI (blue) at day 5 (Scale bar: 50 μm). (D) Semi-quantitative analysis of M2 macrophages (CD68+CD206+ cells). (E) Semi-quantitative analysis of the M1/M2 macrophage ratio. (For B–E: n = 3; data are presented as mean ± SD). ## p < 0.01, #### p < 0.0001 vs. Control group; * p < 0.05, ** p < 0.01, *** p < 0.001 vs. model group; ns indicates no significant difference.

References

    1. Luo Y.L., Luo W.J., Cao Y.N., Wang Z.P. m6A demethylase FTO/ALKBH5 promotes diabetes-induced endothelial cell dysfunction by negatively regulating lncRNA H19. Exp. Mol. Pathol. 2025;143:104970. doi: 10.1016/j.yexmp.2025.104970. - DOI - PubMed
    1. Zaidi S.M.A. Unani treatment and leech therapy saved the diabetic foot of a patient from amputation. Int. Wound J. 2016;13:263–264. doi: 10.1111/iwj.12285. - DOI - PMC - PubMed
    1. Raghav A., Khan Z.A., Labala R.K., Ahmad J., Noor S., Mishra B.K. Financial burden of diabetic foot ulcers to world: A progressive topic to discuss always. Ther. Adv. Endocrinol. 2018;9:29–31. doi: 10.1177/2042018817744513. - DOI - PMC - PubMed
    1. Guo S., DiPietro L.A. Factors Affecting Wound Healing. J. Dent. Res. 2010;89:219–229. doi: 10.1177/0022034509359125. - DOI - PMC - PubMed
    1. Velnar T., Bailey T., Smrkoli V. The Wound Healing Process: An Overview of the Cellular and Molecular Mechanisms. J. Int. Med. Res. 2009;37:1528–1542. doi: 10.1177/147323000903700531. - DOI - PubMed

LinkOut - more resources