. 2025 Sep 29;16(1):1772.
doi: 10.1007/s12672-025-03611-y.

Integrative bioinformatics analysis and elastic network modeling elucidate the role of cellular senescence in meningioma recurrence

Affiliations

Integrative bioinformatics analysis and elastic network modeling elucidate the role of cellular senescence in meningioma recurrence

Jian-Huang Huang et al. Discov Oncol. .

Abstract

Background: Cellular senescence is intimately tied to tumorigenesis and progression, yet its exploration in meningiomas remains inadequate. In this study, we aim to unravel the role of cellular senescence-associated genes (CSA-genes) in meningioma recurrence and identify potential diagnostic markers and therapeutic targets.

Methods: We analyzed GSE136661 and GSE173825 datasets to identify CSA-signature genes through differential expression analysis, weighted gene co-expression network analysis, protein-protein interaction network construction, and elastic net regression modeling. Functional enrichment, immune cell infiltration using CIBERSORT, and transcription factor prediction were performed. Potential drugs were screened using Enrichr database.

Results: A total of 1827 differentially expressed genes (DEGs) were identified, among which 48 were cell senescence-associated differentially expressed genes (CSA-DEGs). Four key CSA-signature genes (CDK1, FOXM1, MYBL2, and BIRC5) were discovered by integrating elastic net regression and network algorithms. The elastic net model demonstrated strong classification performance with an area under the curve (AUC) of 0.816 in distinguishing recurrent meningiomas. Recurrent tumors exhibited significant immune heterogeneity, including increased neutrophils and M0 macrophages (p = 0.007), and CSA-genes were significantly correlated with immune infiltration and checkpoint molecules such as VSIR (p < 0.05). Transcription factor E2F1 was identified as a potential regulator of CSA-signature genes. Drug screening highlighted Dasatinib and Rapamycin as promising candidates with notable anti-meningioma potential.

Conclusion: Our findings highlight crucial genes and pathways in meningioma recurrence, introducing novel therapeutic candidates. These findings pave new avenues for further elucidating meningioma recurrence mechanisms and developing innovative treatments.

Keywords: Cellular senescence; Elastic net; Immune infiltration; Meningioma recurrence.


Conflict of interest statement

Declarations. Ethics approval and consent to participate: Not applicable. Consent for publication: Not applicable. Competing interests: The authors declare no competing interests.

Figures

Fig. 1
Fig. 1
Technical roadmap of this study
Fig. 2
Fig. 2
Differentially Expressed Genes (DEGs) Related to Cellular Senescence and Functional Enrichment Analysis. AC Sample data quality validation from dataset GSE136661 shows no significant outliers, with clear differentiation between the two groups. D Volcano plot depicting the DEGs identified in dataset GSE136661. E Venn diagram illustrating the intersection of DEGs from dataset GSE136661 and cellular senescence-associated genes, yielding the CSA-DEGs
Fig. 3
Fig. 3
Identification of Key Module Genes Using WGCNA. A Dendrogram indicating no significant outliers in the data. B Soft-thresholding power analysis suggests an optimal soft-thresholding power of 12. C, D WGCNA yields four modules, with MEgreen showing the strongest correlation with the trait of interest. E Bubble plot displaying the results of enrichment analysis for genes within the MEgreen module
Fig. 4
Fig. 4
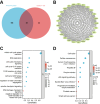
Construction of PPI Network and Functional Enrichment Analysis. A Venn diagram depicting the intersection between genes in the MEgreen module and CSA-DEGs, resulting in 25 CSA-Hub genes. B PPI network of CSA-related genes generated using the Degree algorithm. C, D Bubble plots displaying the results of GO and KEGG enrichment analysis for CSA-related genes
Fig. 5
Fig. 5
Elastic Net Selection of Key Genes and Enrichment Analysis of CSA-Signature Genes. A PCA plot demonstrating the ability of CSA-Hub genes to distinguish between primary and recurrent meningiomas. B Ranking of gene importance based on the elastic net model. C ROC curve illustrating the excellent discriminative ability of the elastic net model. D Venn diagram showcasing the identification of four CSA-signature genes
Fig. 6
Fig. 6
Immune Infiltration Analysis in Meningiomas. A Heatmap depicting significant heterogeneity in immune cell infiltration between primary and recurrent meningioma samples. B Bar chart displaying differences in immune cell proportions between primary and recurrent meningioma groups. C Heatmap showing the correlation between CSA-signature genes and immune cell types. D Heatmap illustrating the correlation between CSA-signature genes and immune checkpoints
Fig. 7
Fig. 7
Validation of CSA-Signature Genes and Exploration of Candidate Transcription Factors. A Bar chart displaying the differential expression analysis of CSA-signature genes in dataset GSE136661. B ROC curve demonstrating the excellent diagnostic performance of CSA-signature genes in dataset GSE136661. C, D Differential expression analysis and diagnostic performance of CSA-signature genes in dataset GSE173825. E, F Validation of candidate transcription factors in datasets GSE136661 and GSE173825

References

    1. Gittleman HR, et al. Trends in central nervous system tumor incidence relative to other common cancers in adults, adolescents, and children in the United States, 2000 to 2010. Cancer. 2015;121:102–12. - PMC - PubMed
    1. Ostrom QT, et al. CBTRUS statistical report: primary brain and other central nervous system tumors diagnosed in the united States in 2010–2014. Neuro Oncol. 2017;19:v1–88. - PMC - PubMed
    1. Materi J, Mampre D, Ehresman J, Rincon-Torroella J, Chaichana KL. Predictors of recurrence and high growth rate of residual meningiomas after subtotal resection. J Neurosurg. 2021;134:410–6. - PubMed
    1. Buerki RA, et al. An overview of meningiomas. Future Oncol. 2018;14:2161–77. - PMC - PubMed
    1. Gousias K, Schramm J, Simon M. The Simpson grading revisited: aggressive surgery and its place in modern meningioma management. J Neurosurg. 2016;125:551–60. - PubMed

LinkOut - more resources