. 2025 Sep 29;21(9):e1011886.
doi: 10.1371/journal.pgen.1011886. eCollection 2025 Sep.

Identifying genetic determinants of outer retinal function in mice using a large-scale gene-targeted screen

Affiliations

Identifying genetic determinants of outer retinal function in mice using a large-scale gene-targeted screen

Janine M Wotton et al. PLoS Genet. .

Abstract

Electroretinography (ERG) provides a noninvasive functional measure of multiple cell types of the outer retina. We conducted an ERG-based screen of 530 single-gene knockout mouse strains generated as part of the International Mouse Phenotyping Consortium, representing 2.5% of all protein-coding genes, to identify genetic variants affecting retinal function. We identified 30 strains with significantly altered ERG amplitudes. Two of the genes identified, Cfap418 and Syne2, have been previously reported with outer retinal dysfunction, thereby serving as internal controls that validate our screening protocol. Of the remaining 28 genes newly associated with altered retinal function, the majority lacked a contemporaneous histopathology correlate, highlighting the importance of ERG in early detection of functional abnormalities. A rare homozygous missense variant in FCHSD2, the human orthologue of one of the 28 genes identified, was found in a patient presenting with retinal degeneration that lacked a molecular diagnosis. This report represents a useful resource for future investigations into the molecular mechanisms driving inherited retinal diseases and demonstrates the power of large-scale ERG screening in identifying novel genetic determinants of retinal function.


Conflict of interest statement

The authors have declared that no competing interests exist.

Figures

Fig 1
Fig 1. Summary of scotopic ERG data analysis.
(a-d) Volcano plots for the four scotopic amplitude parameters: a-wave, b-wave, c-wave, and FO-like wave. Each panel plots the mean-effect percentage against the probability value determined for the four scotopic amplitude parameters (combined for both eyes) for each of 519 knockout strains tested. The p-value threshold profile required to identify a concordant, statistically significant strain was p ≤ 0.01 for each eye and p ≤ 0.0001 for data combined between the two eyes. The red horizontal dashed line indicates p= 0.0001; blue symbols indicate concordant hits (i.e., detected in both eyes). Grey symbols represent genes that did not meet the criteria for statistical significance. In some cases, these genes had a combined p-value ≤ 0.0001 but were not classified as hits because the ERG phenotype was not concordant between eyes (i.e., p > 0.01 in one eye) and were therefore considered non-significant. (e-h) Waterfall plots listing the gene symbol from the 19 knockout strains for which a significant difference from wildtype was detected for any scotopic parameter. Blue indicates that the hit was significant for that parameter, and the associated combined p-value is provided in parenthesis after the gene symbol. Genes that were also significant for a photopic ERG parameter are indicated in bold.
Fig 2
Fig 2. Summary of photopic ERG data analysis.
(a-b) Volcano plots for the two photopic amplitude parameters: a-wave and b-wave. Both panels plot the mean-effect percentage against the probability value determined for the two photopic amplitude parameters (combined for both eyes) for each of 511 knockout strains tested. The p-value threshold profile required to identify a strain as statistically significant was p ≤ 0.01 for each eye and p ≤ 0.0001 for data combined between the two eyes. The red horizontal dashed line indicates p= 0.0001; blue symbols indicate concordant hits (i.e., detected in both eyes). Grey symbols represent genes that did not meet the criteria for statistical significance. In some cases, these genes had a combined p-value ≤ 0.0001 but were not classified as hits because the ERG phenotype was not concordant between eyes (i.e., p > 0.01 in one eye) and were therefore considered non-significant. (c-d) Waterfall plots listing the gene symbol from the 14 knockout strains for which a significant difference from wildtype was detected for either photopic parameter. Blue indicates that the hit was significant for that parameter, and the associated combined p-value is provided in parenthesis after the gene symbol. Genes that were also significant for a scotopic ERG parameter are indicated in bold.
Fig 3
Fig 3. Known genetic determinants of retinal function.
Two genes, Cfap418 and Syne2, known to impact retinal function, were detected among the 530 knockout strains tested and served as internal controls. (a-c) Mean shown inside quartile boxplots (error bars indicate minimum and maximum values) for homozygous knockout (orange) C57BL/6NJ-Cfap418em1(IMPC)J/Mmjax (n = 6) (a), and C57BL/6NJ-Syne2em1(IMPC)J/Mmjax (n = 7) (b-c) mice, and their associated windowed, wildtype controls (grey) for each ERG response amplitude parameter tested. Only wildtype mice with a window weight of 1.0 (rounded to three significant figures) were included in these plots. This selection resulted in the following wildtype group sizes: panel a, by waveform order (a-, b-, c-, and FO-like wave) for left (n = 428, 412, 219, and 148) and right (n = 231, 231, 116, and 231) eye; panel b, by waveform order (a-, b-, c-, and FO-like wave) for left (n = 588, 600, 203, and 191) and right (n = 554, 554, 306, and 306) eye; panel c, by waveform order (a- and b-wave) for left (n = 193 and 57) and right (n = 171 and 97) eye. Left and right eye data are shown separately. Insufficient photopic data were available for strain C57BL/6NJ-Cfap418em1(IMPC)J/Mmjax to trigger statistical analysis. * indicates a concordant significant difference between mutant and wildtype (combined p ≤ 0.0001). (d-f) Representative H&E-stained axial sections adjacent to the optic nerve head of right (OD) eyes from wildtype (d, n = 11 mice, 22 eyes), C57BL/6NJ-Cfap418em1(IMPC)J/Mmjax homozygous knockout (e, n = 4 mice, 8 eyes), and C57BL/6NJ-Syne2em1(IMPC)J/Mmjax homozygous knockout (f, n = 6 mice, 12 eyes) mice. GCL: Ganglion cell layer, IPL: inner plexiform layer, INL: inner nuclear layer, OPL: outer plexiform layer, ONL: outer nuclear layer, PL: photoreceptor layer, RPE: retinal pigment epithelium. The scale bar represents 20 µm. The yellow bars highlight the difference in ONL thickness, while yellow arrowheads in panel (f) highlight mislocalized photoreceptor nuclei.
Fig 4
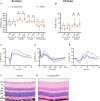
Fig 4. E130308A19Rik, a novel genetic determinant of retinal function.
Abnormalities in scotopic and photopic ERG responses were observed following inactivation of gene E130308A19Rik. (a-b) Mean shown inside quartile boxplots (error bars indicate minimum and maximum values) for homozygous knockout (orange) C57BL/6NJ-E130308A19Rikem1(IMPC)J/Mmjax mice (n = 6) and their windowed, wildtype controls (grey), showing ERG response amplitude parameters for left and right eyes separately. Only wildtype mice with a window weight of 1.0 (rounded to three significant figures) were included in these plots. This selection resulted in the following wildtype group sizes: panel a, by waveform order (a-, b-, c-, and FO-like wave) for left (n = 420, 524, 397, and 337) and right (n = 420, 420, 397, and 552) eye; panel b, by waveform order (a- and b-wave) for left (n = 194 and 371) and right (n = 194 and 185) eye. * indicates concordant significant differences between mutant and wildtype (combined p ≤ 0.0001). (c-e) Average traces (left and right eye combined) for individual mutant mice (solid grey) and the mutant strain average (solid black) compared to averages from all QC-passed wildtype mice (solid blue; scotopic n = 631, photopic n = 624). Scotopic waveforms are shown in two timescales: 225 ms (-25 to 200 ms) (c) highlighting a-wave and b-waves, and 5000 ms (0 to 5000 ms) (d) to visualize the c- and FO-like waves. Photopic waveforms (e) shown as 112.5 ms (-12.5 to 100 ms) of response highlighting a- and b-waves. (f-g) Representative H&E-stained axial sections adjacent to the optic nerve head of OD eyes from C57BL/6NJ-E130308A19Rikem1(IMPC)J/Mmjax homozygous knockout (g, n = 4 mice, 8 eyes), and wildtype (f, n = 11 mice, 22 eyes) mice. GCL: Ganglion cell layer, IPL: inner plexiform layer, INL: inner nuclear layer, OPL: outer plexiform layer, ONL: outer nuclear layer, PL: photoreceptor layer, RPE: retinal pigment epithelium. The scale bar represents 20 µm.
Fig 5
Fig 5. Fhip2a, a novel genetic determinant of retinal function.
Abnormalities in scotopic ERG responses were observed following inactivation of gene Fhip2a. (a) Mean shown inside quartile boxplots (error bars indicate minimum and maximum values) for homozygous knockout (orange) C57BL/6NJ-Fhip2aem1(IMPC)J/Mmjax mice (n = 6) and their windowed, wildtype controls (grey), showing ERG response amplitude parameters for left and right eyes separately. Only wildtype mice with a window weight of 1.0 (rounded to three significant figures) were included in these plots. This selection resulted in the following wildtype group sizes in panel a, by waveform order (a-, b-, c-, and FO-like wave) for left (n = 588, 588, 243, and 254) and right (n = 554, 554, 554, and 254) eye. * indicates concordant significant differences between mutant and wildtype (combined p ≤ 0.0001). Insufficient photopic data were available for strain C57BL/6NJ-Fhip2aem1(IMPC)J/Mmjax to trigger statistical analysis. (b-c) Average traces (left and right eye combined) for individual mutant mice (solid grey) and the mutant strain average (solid black) compared to averages from all QC-passed wildtype mice (solid blue; scotopic n = 631). Scotopic waveforms are shown in two timescales: 225 ms (-25 to 200 ms) (b) highlighting a-wave and b-waves, and 5000 ms (0 to 5000 ms) (c) to visualize the c- and FO-like waves. (d-e) Representative H&E-stained axial sections adjacent to the optic nerve head of OD eyes from C57BL/6NJ-Fhip2aem1(IMPC)J/Mmjax homozygous knockout (e, n = 8 mice, 15 eyes), and wildtype (d, n = 11 mice, 22 eyes) mice. GCL: Ganglion cell layer, IPL: inner plexiform layer, INL: inner nuclear layer, OPL: outer plexiform layer, ONL: outer nuclear layer, PL: photoreceptor layer, RPE: retinal pigment epithelium. The scale bar represents 20 µm. The yellow bars highlight the difference in ONL thickness.
Fig 6
Fig 6. FCHSD2 human variant.
(a) Ophthalmic Genomics Institute (OGI) pedigree of a patient carrying a homozygous variant in FCHSD2. The female proband is represented with a black circle and the clinical diagnosis is mentioned above the pedigree (RCD, rod-cone degeneration). The c.1190A > G variant (V1) was confirmed by Sanger sequencing (arrow), although segregation could not be performed due to the lack of parental DNA, thus the variant is indicated as [V1(;)V1]. (b) Fundus photographs show attenuated retinal vessels and sparse bone spicule pigmentation in the periphery of both eyes. OD: right eye, OS: left eye. Scotopic (n = 10) and photopic (n = 9) ERG responses were measured in Fchsd2 knockout mice. (c-d) Mean shown inside quartile boxplots (error bars indicate minimum and maximum values) for homozygous knockout (orange) C57BL/6NJ-Fchsd2em1(IMPC)J/Mmjax mice and their windowed, wildtype controls (grey), showing ERG response amplitude parameters for left and right eyes separately. Only wildtype mice with a window weight of 1.0 (rounded to three significant figures) were included in these plots. This selection resulted in the following wildtype group sizes: panel c, by waveform order (a-, b-, c-, and FO-like wave) for left (n = 109, 212, 108, and 153) and right (n = 212, 212, 274, and 69) eye; panel d, by waveform order (a- and b-wave) for left (n = 102 and 125) and right (n = 53 and 102) eye. * indicates concordant significant differences between mutant and wildtype (combined p≤ 0.0001).

References

    1. Strauss O. The retinal pigment epithelium in visual function. Physiol Rev. 2005;85(3):845–81. doi: 10.1152/physrev.00021.2004 - DOI - PubMed
    1. Baylor DA, Lamb TD, Yau KW. Responses of retinal rods to single photons. J Physiol. 1979;288:613–34. - PMC - PubMed
    1. Lu Y, Shiau F, Yi W, Lu S, Wu Q, Pearson JD, et al. Single-Cell Analysis of Human Retina Identifies Evolutionarily Conserved and Species-Specific Mechanisms Controlling Development. Dev Cell. 2020;53(4):473-491.e9. doi: 10.1016/j.devcel.2020.04.009 - DOI - PMC - PubMed
    1. Shekhar K, Sanes JR. Generating and Using Transcriptomically Based Retinal Cell Atlases. Annu Rev Vis Sci. 2021;7:43–72. doi: 10.1146/annurev-vision-032621-075200 - DOI - PubMed
    1. Baehr W, Hanke-Gogokhia C, Sharif A, Reed M, Dahl T, Frederick JM, et al. Insights into photoreceptor ciliogenesis revealed by animal models. Prog Retin Eye Res. 2019;71:26–56. doi: 10.1016/j.preteyeres.2018.12.004 - DOI - PMC - PubMed

Substances

LinkOut - more resources