. 2025 Oct 7;122(40):e2506761122.
doi: 10.1073/pnas.2506761122. Epub 2025 Sep 29.

A mouse model of MEPAN demonstrates a role for mitochondrial fatty acid synthesis in iron-sulfur cluster and supercomplex formation

Affiliations

A mouse model of MEPAN demonstrates a role for mitochondrial fatty acid synthesis in iron-sulfur cluster and supercomplex formation

Deborah G Murdock et al. Proc Natl Acad Sci U S A. .

Abstract

MEPAN (Mitochondrial Enoyl CoA Reductase Protein-Associated Neurodegeneration) is an early-onset movement disorder characterized by ataxia, dysarthria, and optic atrophy. Here, we report the creation of a mouse model of MEPAN with patient-similar compound heterozygous mutations in the Mecr gene. The MEPAN mouse recapitulates the major hallmarks of MEPAN, including a movement disorder, optic neuropathy, defects in protein lipoylation, and reduced mitochondrial oxidative phosphorylation in the brain. MECR catalyzes the last step in mitochondrial fatty acid synthesis (mtFASII), and the mechanism by which loss of mtFASII leads to neurological disease is unknown. LC-MS/MS-based proteomic analysis of Mecr mutant cerebella identified loss of subunits of complex I of oxidative phosphorylation (OXPHOS) and subunits of the iron-sulfur cluster assembly (ISC) complex. Native gels revealed altered OXPHOS complex and supercomplex formation and changes in binding of the acyl carrier protein (ACP) to mitochondrial complexes. These results demonstrate that MECR plays a key role in the acylation of ACP which is necessary for ACP-LYRM-mediated supercomplex modulation and ISC biogenesis and suggest unique pathways for therapeutics.

Keywords: genetics; iron; mitochondrial disease; mitochondrial fatty acid synthesis; mouse model.


Conflict of interest statement

Competing interests statement:D.C.W. is on the scientific advisory board of Pano Therapeutics, Inc. and Medical Excellence Capital.

Figures
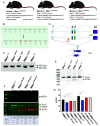
Fig. 1.
Fig. 1.
Creation of a mouse model of MEPAN using CRISR-Cas9 genomic editing. (A) Sequence of the three mice that were born after CRISPR-Cas9 editing. Mouse 1 had the T285C mutation on one allele and 10 bp deletion on the other allele. Mouse 2 had the T285C mutation on both alleles and an additional 79 bp deletion on one allele. Mouse 3 had the T285C mutation on one allele and a one bp insertion on the other allele. (B) The design of the c.854A>G (p.Tyr285Cys) point mutation created by CRISPR-Cas9 editing. The first nucleotide change (AG in red) changes MECR tyrosine 285 to a cysteine, a change that is pathogenic in humans. The second mutation (GA) is required to create the PAM site for CRISPR-Cas9 editing and is silent. (CE, and G) Mouse 2 has the T285C point mutation on both alleles (red star in exon 8) and a 79 bp deletion (del79) between exons 7 and 8 on the second allele. (D) PCR amplification of genomic DNA from mouse 2 demonstrates the 79 bp deletion. (E) Diagram showing alternative splicing of Mecr mRNA due to the 79 bp deletion upstream of exon 8 in mouse 2. Alternative splicing of exon 7 to exon 10 in the Mecr mRNA eliminates exons 8 and 9, creating a frameshift in the Mecr open reading frame. (F) MECR protein (Top panel) and lipoylation of proteins (Middle panel) are reduced in the brain of all Mecr mutant mice as determined by SDS-PAGE immunoblotting. Quantitation of bands normalized to actin in shown for all mutants (Lower panel). (G) All Mecr mutant mice have lower body mass at 3 mo of age (n = 13–17 per group). (G) Amplification of reverse-transcribed RNA from mouse 2 shows del79 results in a smaller cDNA band missing exons 8 and 9.
Fig. 2.
Fig. 2.
Localization of MECR and lipoylated proteins in the WT and Mecr 285/del10 mouse brain. (A) Sagittal sections of whole brain from WT (Left side) and Mecr285/del10 (Right side) mice were stained with an antibody to MECR (Top half) or to lipoylated proteins (Bottom half). (B) Higher magnification of the olfactory bulb stained with MECR antibody in a WT mouse. (C) Higher magnification of tanycytes stained with an MECR antibody in a WT mouse. (D) Coronal section of WT brain through the central aqueduct and midbrain/hindbrain. Close-ups of stained regions are a) lining of the central aqueduct, b) midbrain trigeminal nucleus, and c) motor nucleus of the trigeminal nerve. Also labeled are d) the ventral cochlear nucleus and e) the principal sensory nucleus of the trigeminal nerve. E) Sagittal sections of the cerebellum of WT (first and third columns) and Mecr285/del10 (second and fourth columns) with corresponding close-up of one lobe stained with an MECR antibody (Left two columns) or a calbindin antibody (Right two columns) as a marker of Purkinje cells. (for whole brain, n = 4–7 animals for each genotype, for the cerebellum n = 4–9 animals for each genotype).
Fig. 3.
Fig. 3.
Mecr 285/del10 mice have hallmarks of MEPAN disease, including movement abnormalities and balance deficits, in addition to olfactory dysfunction. (A) In the open-field test, the Mecr mutant mice show less distance traveled, (B) reduced speed of ambulation, and (C) fewer rearings (n = 9–17 mice per genotype). (D) Mecr285/del10 failed significantly more quickly on all of nine trials on the rotarod. WT mice are shown as black circles, and Mecr285/del10 mice are shown as pink triangles. Results shown are the average time to fail with error bars for SE of the mean (n = 9–16 mice per genotype). (E and F) Reduced forepaw and all-paw grip strength in Mecr mutant mice (n = 9–15 mice per genotype). (G and H) are averaged results from analysis of gait testing. All Mecr mutants had slower left foot and right foot swing speed as well as decreased body speed (n = 9–16 mice per genotype). (I) All of the mutants deviated from wild-type mice in step sequence. Gait patterns are AA, RF-RH-LF-LH; AB, LF-RH-RF-LH; CA, RF-LF-RH-LH; CB, LF-RF-LH-RH, where R = right, L = left, F = forepaw, and H = hind paw (n = 9–16 mice per genotype). (J) Olfactory test. Time spent sniffing in each of fifteen trials was measured. In trials 1–3, the stimulus was water, in trials 4–6, the stimulus was almond scent, in trials 7–9, the stimulus was vanilla scent, in trials 10–12, the stimulus was same sex mouse scent, and in trials 13–15, the stimulus was opposite sex mouse scent (n = 6–7 mice per genotype).
Fig. 4.
Fig. 4.
Mecr mutant mice have reduced respiration in the cerebellum, but not the cortex, compared to wild-type mice. (A) Respiration in the cortex and cerebellum of WT vs Mecr285/del10 mice. PMG = complex I-linked leak respiration (substrates pyruvate, malate, and glutamate); ADP = ADP stimulated; SUCC= OXPHOS capacity with PMG and succinate; OLIGO = leak respiration with oligomycin; FCCP = uncoupled mitochondria; Rot = rotenone inhibition of complex I demonstrating complex II-linked respiration AA= antimycin A (n = 4–5 mice per genotype). (B) Ratio of mitochondrial DNA (mtDNA) to nuclear DNA (nDNA) in the cortex (ctx) and cerebellum (cereb) of wild-type (wt) and Mecr285/del10 (del10) mice as measured by quantitative real-time PCR normalized to ratio in the wild-type cerebellum. * = P < 0.05; ** = P < 0.005.
Fig. 5.
Fig. 5.
Proteomics analysis shows changes in several groups of proteins in the Mecr285/del10 mutant cerebellum. (A) Volcano plot of comparison of proteins in the WT and Mecr285/del10cerebellum. Components of complex I of the electron transport chain are circled. (B) Top three downregulated proteins in the Mecr285/del10cerebellum are MECR followed by LYRM4 and NFS, components of the iron–sulfur cluster assembly complex. (C) Representative images of western analysis of ISC assembly complex LYRM4, NFS, and ACP (n = 3 mice per genotype per blot and were repeated at least twice). (D) List of molecular functions significantly downregulated in the Mecr285/del10cerebellum, their fold enrichment, and P value as determined by pathway analysis. (E and F) Defective lipoylation of proteins can be identified in mass spectrometry data by unmasking of trypsin sites.
Fig. 6.
Fig. 6.
Mitochondrial respiratory complex formation and activity are altered in the Mecr285/del10 (M1-3) cerebellum. Representative immunoblots (A, C, E, F, H, I, K, and L) and in-gel activity assays (B, D, G, and I) of mitochondrial proteins run on native PAGE gels. Gels were transferred to PVDF and probed with antibody to (A) complex I, (C) complex IV, (E) complex III,) (F) complex V, (H) complex II. (J) ACP (NDUFAB1), and components of the ISC assembly complex (K) α-ISCU and (L) α-LYRM4. (M) Aconitase activity in the cerebellum of WT and Mecr285/del10 mice (n = 3 mice per genotype and repeated at least twice). W = wild type; M = Mecr285/del10.

References

    1. Heimer G., Gregory A., Hogarth P., Hayflick S., Ben Zeev B., MECR-Related neurologic disorder. GeneReviews 31070877 (1993). - PubMed
    1. Heimer G., et al. , MECR mutations cause childhood-onset dystonia and optic atrophy, a mitochondrial fatty acid synthesis disorder. Am. J. Hum. Genet. 99, 1229–1244 (2016). - PMC - PubMed
    1. Fiorini C., et al. , Recessive MECR pathogenic variants cause an LHON-like optic neuropathy. J. Med. Genet. 61, 93–101 (2023). - PMC - PubMed
    1. Jia N., et al. , Recurrent MECR R258W causes adult-onset optic atrophy: A case report. Eur. J. Med. Genet. 68, 104917 (2024). - PubMed
    1. Gorukmez O., Gorukmez O., Havali C., Novel MECR mutation in childhood-onset dystonia, optic atrophy, and basal ganglia signal abnormalities. Neuropediatrics 50, 336–337 (2019). - PubMed

Substances

LinkOut - more resources