. 2025 Dec:102:102261.
doi: 10.1016/j.molmet.2025.102261. Epub 2025 Sep 27.

Activin receptor type IIA/IIB blockade increases muscle mass and strength, but compromises glycemic control in mice

Affiliations

Activin receptor type IIA/IIB blockade increases muscle mass and strength, but compromises glycemic control in mice

Michala Carlsson et al. Mol Metab. 2025 Dec.

Abstract

Purpose: Blocking the Activin receptor type IIA and IIB (ActRIIA/IIB) has clinical potential to increase muscle mass and improve glycemic control in obesity, cancer, and aging. However, the impact of blocking ActRIIA/IIB on strength, metabolic regulation, and insulin action remains unclear.

Methods: Here, we investigated the effect of short- (10 mg kg-1 bw, once, 40h) or long-term (10 mg kg-1 bw, twice weekly, 21 days) antibody treatment targeting ActRIIA/IIB (αActRIIA/IIB) in lean and diet-induced obese mice and engineered human muscle tissue.

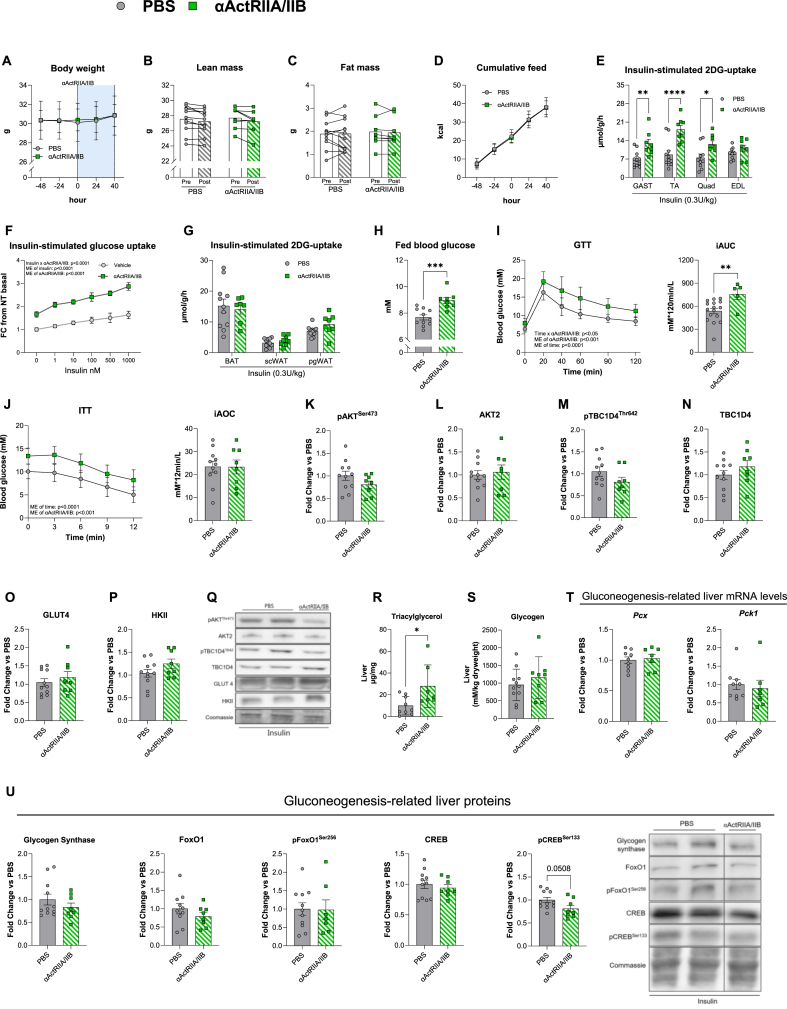
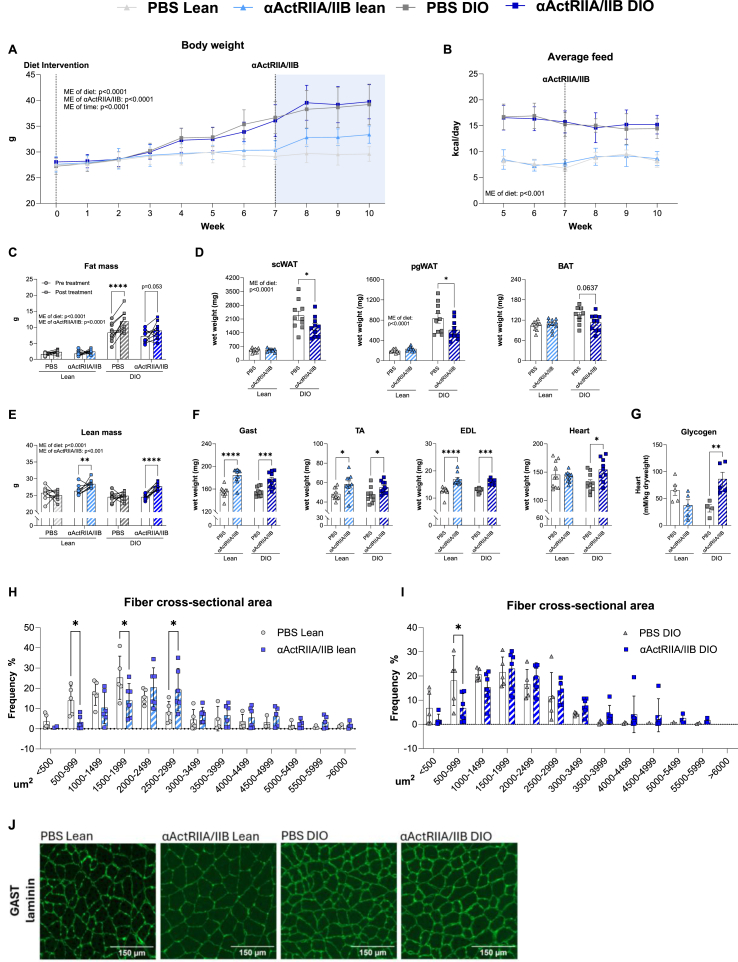
Results: Short-term α ActRIIA/IIB administration in lean mice increased insulin-stimulated glucose uptake in skeletal muscle by 76-105%. Despite this, αActRIIA/IIB-treated mice exhibited 33% elevated blood glucose and glucose intolerance. Long-term αActRIIA/IIB treatment increased muscle mass (+20%) and reduced fat mass (-8%) in obese mice but failed to enhance insulin-stimulated glucose uptake in muscle or adipose tissue. Instead, it induced glucose intolerance, cardiac hypertrophy with glycogen accumulation, and elevated hepatic triacylglycerol and glucose output in response to pyruvate. Concomitantly, long-term αActRIIA/IIB treatment increased strength (+30%) in mouse soleus muscle and prevented activin A-induced loss of tissue strength in engineered human muscle tissue. Surprisingly, long-term α ActRIIA/IIB treatment lowered volitional running (-250%).

Conclusions: Our findings demonstrate that, in accordance with human studies, ActRIIA/IIB blockade holds promise for increasing muscle mass, strength, and muscle insulin sensitivity. However, contrary to the improved glycemic control in humans, ActRIIA/IIB blockade in mice causes severe glucose intolerance and lowers voluntary physical activity. Our study underscores the complex metabolic and functional consequences of ActRIIA/IIB blockade, and highlight species differences on glycemic control, which warrant further investigation.

Keywords: Activin receptor; Bimagrumab; Glycemic regulation; Insulin resistance; Muscle mass; Obesity.


Conflict of interest statement

Declaration of competing interest CH-O, PB, MHH, and JRK are employed at Novo Nordisk S/A. Andreas Lodberg has served as a consultant or has received advisory fees from Acarios, Aureka Biotechnologies, Bluejay Therapeutics, Epirium Bio, and Morgan Stanley. Andreas Lodberg has performed sponsored research for Keros Therapeutics.

Figures

Figure 1
Figure 1
Short-term ActRIIA/IIB receptor inhibition blockadebyαActRIIA/IIB antibody improves muscle insulin sensitivity, but causes whole-body glucose intolerance. A) Body weight development in control PBS treated and αActRIIA/IIB treated mice recorded 48h prior to αActRIIA/IIB treatment until 40h after treatment B) Magnetic Resonance Imaging-derived lean mass, and C) fat mass before (Pre) and 40h after (post) αActRIIA/IIB treatment. D) Cumulative kcal intake. E) 2-deoxy glucose (2DG) uptake of Gastrocnemius muscle (Gast), Tibialis Anterior (TA), Quadriceps (Quad), Extensor Digitorum Longus (EDL). F) Insulin-stimulated glucose uptake in primary human myotubes treated with αActRIIA/IIB for 96h (from day 4 myotubes) to block ActRIIA/IIB signaling. Values are shown as fold change (FC) from non-treated (NT) basal. G) 2DG of adipose tissue, Brown adipose tissue (BAT), Subcutaneous white adipose tissue (ScWAT), and Perigonadal WAT (PgWAT). H) Blood glucose in the fed state 24 h after αActRIIA/IIBab treatment. I) Glucose tolerance test (GTT) (Lean PBS: n = 16 and Lean αActRIIA/IIB: n = 5) with incremental area under the curve (iAUC). Mice that did not respond to the glucose injection (Blood glucose 10 mM at TP 20 min) were excluded from the dataset. J) Insulin tolerance test (ITT) with incremental area over the curve (iAOC). Western blot from gastrocnemius muscle with Protein expression of K) phosphorylated (p) pAKTSer473cat#9271, L) AKTII cat#3063, M) pTBC1D4Thr642 cat#4288, N) TBC1D4 cat#ab189890, O) GLUT4 cat#PA1-1065, P) HKII cat#2867, Q) Representative blots from western blotting. R) Liver triacylglycerol content. S) Liver glycogen content. T)Pcx and Pck1 gene expression levels in liver tissue measured by real-time qPCR. U) Western blot from liver tissue of glycogen synthase cat#3886, FoxO1 cat#sc-11350, pFoxO1Ser256 cat#9461, CREB cat#4820S, and pCREBSer133 cat#9198S, and representative blot. Lean PBS: n = 8–11 Lean αActRIIA/IIB: n = 8, Values are shown as mean ± SEM including individual values, and as mean ± SD when individual values are not shown. Effect of αActRIIA/IIB: ∗ = p < 0.05, ∗∗ = p < 0.01, ∗∗∗ = p < 0.001.
Figure 2
Figure 2
Long-termαActRIIA/IIB antibody treatment elevates muscle mass and protect against HFHS-induced adiposity expansion. A) Body weight development before and after diet intervention (control chow diet (Lean) or a high-fat high-sucrose diet (DIO)) and αActRIIA/IIB or PBS treatment. B) Average daily caloric intake (excluding sucrose water consumption). C) Magnetic Resonance Imaging-derived fat mass. D) Weight of subcutaneous white adipose tissue (scWAT), perigonadal WAT (pgWAT), and Brown adipose tissue (BAT). E) Lean mass. F) whole muscle weights of Gastrocnemius (Gast), Tibialis Anterior (TA), Extensor Digitorum Longus (EDL), and heart. G) Heart glycogen content. H) Average fiber cross-sectional area distribution in % (single fiber segmentation average 50–300 fibers pr. picture) in Gast of lean mice and I) DIO mice. J) Representative imaging of laminin-stained Gast muscle fiber slides. PBS Lean: n = 10 αActRIIA/IIB Lean: n = 10 DIO PBS: n = 10, DIO α ActRIIA/IIB: n = 10. For heart glycogen; PBS Lean: n = 5 αActRIIA/IIB Lean: n = 5 DIO PBS: n = 5, DIO α ActRIIA/IIB: n = 5. Values are shown as mean + -SEM including individual values, and as mean + −SD when individual values are not shown. Effect of αActRIIA/IIB: ∗ = p < 0.05, ∗∗ = p < 0.01, ∗∗∗ = p < 0.001
Figure 3
Figure 3
Mice treated withαActRIIA/IIB antibody display increased muscle force ex vivo, but have markedly reduced activity in voluntary wheel running. A) Absolute force trace of isolated soleus muscles in αActRIIA/IIB or PBS treated mice. Soleus muscles were placed under resting tension ( 5 mN) followed by electrical stimulation at 14V and 149.2 Hz with a pulse width and interval of 0.2 ms and 6.5 ms, respectively. Trains of pulses were delivered 75 times with a pause of 5000 ms between pulses, which was repeated 110 times with 2000 ms of pause between pulse trains, allowing for maximal force development. B) Accumulated force from absolute force trace C) The muscles were measured in length and weight following the electrical stimulation protocol to calculate specific force (wt(mg)/[(length(mm)∗Lf∗1,06]). 14-week-old male mice received two αActRIIA/IIB injections (days 0 and 14), and soleus muscle force was assessed on day 21. D) Force assessment in engineered human muscle tissue. Cells were treated with either vehicle or 1 μM αActRIIA/IIB , Cat #: HY-P99355, MedChem). On day 20, activin A (1 nM) was added to the respective groups. Force assessment was performed every 2 days, and force output was normalized to day 20, when activin A treatment began (left panel). Force output normalized to day 20 at the end of the intervention is shown in the right panel. Force was monitored during electrical stimulation at 1-2-3-5-10-20-30 and 40Hz each at a 2sec duration with 8 s in between stimulations. Each stimulation consisted of biphasic 75mAmp pulses of 10 ms duration Media, including treatment groups, was changed every second day. E) Voluntary wheel-running intervention. 14-week-old αActRIIA/IIB-treated, and PBS-treated mice were given free access to running wheels for four weeks. Values are shown as + -SEM including individual values, and as mean + −SD when individual values are not shown. Effect αActRIIA/IIB: ∗ = p < 0.05, ∗∗∗ = p < 0.001, ∗∗∗∗ = p < 0.0001.
Figure 4
Figure 4
Long-termαActRIIA/IIB antibody treatment causes whole-body glucose intolerance without effect on glucose uptake and insulin signaling downstreamofAKT. A) Fed blood glucose measured the last week of long-term αActRIIA/IIB treatment. B) Blood glucose levels before (0min), 20min, 40 min, 60 min and 90min following an intraperitoneal glucose tolerance test (2 g kg−1 body weight), with incremental area under the curve (iAUC) C) Plasma insulin from blood drawn at timepoint 0 and after 20 min of the glucose tolerance test, with fold change from TP0. D) Blood glucose levels measured at timepoints 0 min, 3 min, 6 min, 9 min, and 12 min following retro-orbital insulin injection (0.3 U/kg body weight) and incremental area over the curve (iAOC) during the 12 min insulin stimulation. iAUC and iAOC were calculated using the trapezoid rule. E) 2-deoxy glucose (2DG) uptake of Gastrocnemius muscle (Gast), Tibialis Anterior (TA), Extensor Digitorum Longus (EDL), Quadriceps (Quad), and heart. F) 2DG of Perigonadal white adipose tissue (PgWAT), Subcutan WAT (ScWAT), and Brown adipose tissue (BAT). Western blot- Protein expression of G) phosphorylated (p) pAKTSer473cat#9271, H) AKTII cat#3063, I) HKII cat#2867, J) GLUT4 cat#PA1-1065, K) pTBC1D4Thr642 cat#4288, L) TBC1D4 cat# ab189890. M) Representative blots. N) Pyruvate tolerance test performed 7 days after a single αActRIIA/IIB administration. iAUC was calculated from the basal blood glucose concentration determined using the trapezoid rule for the 90 min test. Gene expression levels in liver tissue measured by real-time qPCR. O) Liver triacylglycerol content. P) Liver glycogen content. Q)Pcx and Pck1 gene expression levels in liver tissue measured by real-time qPCR.R) Western blot from liver tissue of glycogen synthase cat#3886, FoxO1 cat#sc-11350, pFoxO1Ser256 cat#9461, CREB cat#4820S, and pCREBSer133 cat#9198S, and representative blot. Values are shown as mean + -SEM including individual values, and as mean + −SD when individual values are not shown. Effect of αActRIIA/IIB: ∗ = p < 0.05, ∗∗ = p < 0.01, ∗∗∗ = p < 0.001.

References

    1. Egerman M.A., Glass D.J. Signaling pathways controlling skeletal muscle mass. Crit Rev Biochem Mol Biol. 2014;49:59–68. - PMC - PubMed
    1. Valenzuela P.L., Maffiuletti N.A., Tringali G., De Col A., Sartorio A. Obesity-associated poor muscle quality: prevalence and association with age, sex, and body mass index. BMC Muscoskelet Disord. 2020;21:1–8. - PMC - PubMed
    1. Tisdale M.J. Mechanisms of cancer cachexia. Physiol Rev. 2009;89:381–410. - PubMed
    1. Dhanapal R., Saraswathi T.R., Govind Rajkumar N. Cancer cachexia. J Oral Maxillofac Pathol. 2011;15:257. - PMC - PubMed
    1. Haines MS., Dichtel LE., Santoso K., Torriani M., Miller KK., Bredella MA. Association between muscle mass and insulin sensitivity independent of detrimental adipose depots in young adults with overweight/obesity. Int J Obes. 2020;44:1851. - PMC - PubMed

LinkOut - more resources