. 2025 Sep 29;16(1):8560.
doi: 10.1038/s41467-025-63554-4.

A loss-of-function human ADAR variant activates innate immune response and promotes bowel inflammation

Affiliations

A loss-of-function human ADAR variant activates innate immune response and promotes bowel inflammation

Pengfei Xu et al. Nat Commun. .

Abstract

Inflammatory bowel disease (IBD) arises from genetic-environmental interactions. Adenosine deaminases acting on RNA 1 (ADAR), an RNA-editing enzyme converting adenosine (A) to inosine (I), is essential for tissue homeostasis. Here we report that intestinal ADAR deficiency contributes to IBD pathogenesis in humans with reduced ADAR expression in patient intestinal crypts. Genetic or pharmacological inhibition of ADAR in mice causes spontaneous ileitis and colitis. Organoid studies show that ADAR loss leads to double-strand RNA (dsRNA) and endogenous retroviruses (ERVs) accumulation, disrupting intestinal homeostasis via melanoma differentiation-associated protein 5 (MDA5)-mediated dsRNA sensing and Janus kinase (JAK)-signal transducer and activator of transcription (STAT) signaling. Editome analyses identify Mda5 as an ADAR target, and edited Mda5 exhibits impaired dsRNA sensing. The human ADAR p.N173S mutation is a loss-of-function variant that fails to rescue IBD in intestinal Adar deficient mice, whereas JAK1/2 inhibitor Ruxolitinib attenuates IBD. We conclude that the ADAR-dsRNA/ERVs-MDA5-JAK/STAT axis is a potential therapeutic target for IBD.


Conflict of interest statement

Competing interests: The authors declare no competing interests.

Figures

Fig. 1
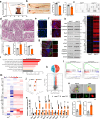
Fig. 1. Identification of ADARN173S as a loss function mutation that correlated with IBD incidence in patients.
a Observed-to-expected ratio of variants in ADAR based on the Genome Aggregation Database (gnomAD, https://gnomad.broadinstitute.org). pLoF predicted loss-of-function variants. b Allele frequency of the 1: 154574702T/G variant, (p.Gln139Pro), 1:154557848A/G variant, and 1:154574600T/C variant (p.Asn173Ser) in the Finnish (FIN) IBD (UC and CD) and non-IBD population as obtained through the IBD exomes browser (http://ibd.broadinstitute.org). Shown below are the carrier rates of different variants in a Finnish cohort. OR: odds ratio. c The structure of human ADAR and the Asn173 and Gln139 sites (right) predicted by AlphaFold. d The A-to-I RNA editing activity (left) and ADAR protein expression (right) in HCT116 cells transfected with shControl or shADARp110 with or without reconstitution by ectopic expression of WT human ADAR or ADARN173S (n = 3). e Sequence chromatograms of the GLI1 gene transcript in the indicated cell groups. The A to G editing efficiencies are labeled. Data are presented as the mean ± SEM. The statistical significance was analyzed using Fisher’s exact test (Fig. 1b). The remaining statistical differences were determined using unpaired two-tailed t-test. Source data are provided in the Source data file.
Fig. 2
Fig. 2. The expression of ADAR is specifically decreased in the gut epithelium of IBD patients and mice.
a Representative IHC staining of ADAR in normal human colon (n = 10) and surgical specimens from patients with IBD (Crohn’s disease n = 4, chronic colitis n = 5). Red arrowheads indicate crypts. Shown right are the quantifications of relative ADAR intensity. Scale bars: 100 μm. Representative immunofluorescence (IF) (b) and IHC (c) staining of Adar in colon tissues of vehicle control mice or colitis mice induced by 6-day treatment with 2% DSS (n = 8 for Vehicle, n = 10 for DSS-6d). Red arrowheads indicate crypts. Shown on the right are the quantifications of relative Adar intensity. Scale bars: 100 μm. The statistical differences were determined using unpaired two-tailed t-test. Source data are provided in the Source data file.
Fig. 3
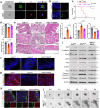
Fig. 3. Intestinal epithelial- or stem cell-specific ablation of ADAR triggers spontaneous bowel inflammation and compromises intestinal organoid growth.
a Survival curves of Adarfl/fl and AdariΔgut mice after tamoxifen induction and representative appearance of intestinal edema (insert) (n = 8). b Representative images of the gastrointestinal tract at 3 days post tamoxifen induction (3 dpi) with the quantifications of colon and small intestine length shown on the right (n = 6 for Adarfl/fl, n = 7 for AdariΔgut). c Dot blots of 40 inflammatory factors in the serum by mouse inflammation antibody array with the heatmap quantifications of dot intensity shown below (n = 3 mice combined serum in each group, and shown are duplicate results of each factor, array map information is provided in Supplementary Table 3). d H&E staining of intestinal sections at 3 dpi. Scale bars: 100 μm. Graphs below are histopathological scores and lengths of ileal crypts and villi (n = 5 for Adarfl/fl, n = 3 for AdariΔgut). e Representative images of TUNEL staining (green) on the ileal sections at 3 dpi. Scale bars: 100 μm. f Immunofluorescence of E-cadherin (red) staining at 3 dpi. Scale bars: 100 μm. g Immunofluorescence of Lysozyme (green) and Muc2 (red) staining at 3 dpi. Scale bars: 100 μm. h Western blot analysis of ileal samples at 3 dpi (n = 3). i Top hallmark categories of upregulated genes based on RNA-seq results derived from ileal crypts of Adarfl/fl and AdariΔgut mice at 3 dpi. j 3D PCoA score plot of different samples (n = 3). k Volcano plot of differentially expressed genes (Log2 (Fold change) > 1, P < 0.05), blue and red indicate downregulated and upregulated genes, respectively. The number of genes changed are shown in the pie chart (upper). l GSEA of the pathways related to type I IFN and IFNγ production. m Heatmap of the expression of inflammation-related genes from RNA-seq (n = 3). n Relative mRNA expression of inflammatory genes in the ileum measured by qRT-PCR (n = 3 for Adarfl/fl, n = 4 for AdariΔgut). o Representative images and Caspase 3/7 activity (green) and propidium iodide (PI, red) staining of organoids isolated from the ileum of Villin-CreERT2 Adarfl/fl mice and treated with or without 4-OHT (200 nM) at 6 day. Shown on the right are the quantifications of relative PI and Caspase 3/7 signals. n = 5, Scale bars: 100 μm.Data are presented as the mean ± SEM. The statistical significance was analyzed using Log-rank (Mantel-Cox) test (Fig. 3a). The remaining statistical differences were determined using unpaired two-tailed t-test. Source data are provided in the Source data file.
Fig. 4
Fig. 4. Adar deletion leads to the accumulation of endogenous retroviruses.
a GSEA of the pathways related to anti-virus from RNA-seq results derived from ileal crypts of Adarfl/fl and AdariΔgut mice (3 dpi). b RNA-seq results to show the level of ERVs in the ileal crypts of Adarfl/fl and AdariΔISC mice at 3dpi (n = 3). c Relative expression of ERV species in the ileum as determined by qRT-PCR (n = 3). d Biopsies from patients with IBD and unaffected controls were analyzed for virus mimicry repeats (analysis of a public database). Data are presented as the mean ± SEM. The statistical differences were determined using unpaired two-tailed t-test. Source data are provided in the Source data file.
Fig. 5
Fig. 5. MDA5-mediated dsRNA sensing is required for intestinal Adar deficiency-induced bowel inflammation and organoid death.
a Representative images of Adar (green) and J2 (red) staining in organoids isolated from the ileum of Villin-CreERT2 Adarfl/fl mice and treated with or without 4-OHT (200 nM) for 3 days.Scale bars: 100 μm. b Representative images of J2 staining (green) on ileal sections of Adarfl/fl and AdariΔgut mice (3 dpi). Scale bars: 100 μm. c Survival curves of Adarfl/fl, AdariΔgut, and AdariΔgutMda5−/−mice after tamoxifen induction (n = 5 for Adarfl/fl, n = 8 for AdariΔgut, n = 6 for AdariΔgutMda5−/−). d, h Adarfl/fl, AdariΔgut and AdariΔgutMda5−/− mice after tamoxifen induction at 3-dpi. d Small intestine and colon length (n = 5 for Adarfl/fl, n = 7 for AdariΔgut, n = 6 for AdariΔgutMda5−/−). e H&E staining of intestinal sections. Scale bars: 100 μm. Shown on the right are quantifications of histopathological scores, and lengths of ileal crypts and villi (n = 5). f Representative images of TUNEL staining (green) on the ileal sections. Scale bars: 100 μm. g Immunofluorescence of E-cadherin (red) staining. Scale bars: 100 μm. h Immunofluorescence of Lysozyme (green) and Muc2 (red) staining. Scale bars: 100 μm. i Western blot analysis of ileal samples (n = 3). j Representative images of the growth process of organoids isolated from the ileum of AdariΔgut and AdariΔgutMda5−/− mice treated with or without 4-OHT. Scale bars: 100 μm. Data are presented as the mean ± SEM. The statistical significance was analyzed using Log-rank (Mantel-Cox) test (Fig. 5c). The remaining statistical differences were determined using one-way ANOVA with multiple comparisons. Source data are provided in the Source data file.
Fig. 6
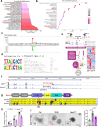
Fig. 6. Mda5 is a target of Adar-mediated RNA editing, which decreases its dsRNA sensing activity.
a, b The top 30 HALLMARK (A) and top 20 KEGG (B) enrichment analysis of A-to-I editing site containing genes from RNA-seq results derived from ileal crypts of Adarfl/fl and AdariΔgut mice (3 dpi). c Two sample logo (http://www.twosamplelogo.org) visualization of the differences between two sets of aligned samples of amino acids of A-to-I editing sites. Editing sites (the A nucleotide at position 0) are aligned together. d Consensus motif identified by Homer in the ±50 nt neighborhood centered around each of the predicted A-to-I editing sites (n = 3). e Strategy for combined RNA A-to-I editome and RNA transcriptome analysis. f RNA-seq at the Mda5 locus indicating positions of A-to-I editing site (62440874) from Adarfl/fl and AdariΔgut mice. The editing efficiency is labeled. g Domain structures of Mda5 and the alignment of sequences. h IFN-β reporter activity stimulated by flag-tagged WT Mda5 and mutant Mda5I480V in the absence or presence of poly (I:C) dsRNA (0, 250, 500 ng/mL) in HEK 293 T cells (n = 4). i Representative images of the organoids isolated from the ileum of AdariΔgutMda5−/− mice infected with lenti-Ctrl, lenti-Mda5, and lenti-Mda5I480V and then treated with 4-OHT at 6 days. Shown on the right are the quantifications of relative PI signals (n = 5). Scale bars: 100 μm. Data are presented as the mean ± SEM. The statistical significance was analyzed using unpaired two-tailed t-test (Fig. 6h) and one-way ANOVA with multiple comparisons (Fig. 6i). Source data are provided in the Source data file.
Fig. 7
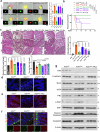
Fig. 7. Ruxolitinib attenuates Adar deficiency-induced organoid death and bowel inflammation.
a Representative images and Caspase 3/7 activity (green) and PI (red) staining of organoids isolated from the ileum of Villin-CreERT2 Adarfl/fl mice and treated without or with 4-OHT (200 nM) and co-treated with 1 μM Ruxolitinib (Rux), Tofacitinib (Tof), Fedratinib (Fed), or Itacitinib (Ita) for 5 days. Shown on the right are the quantifications of relative PI and Caspase 3/7 signals. (n = 5). Scale bars: 100 μm. b Survival curves of Adarfl/fl and TMX induced AdariΔgut mice co-treated with Rux (60 mg/kg/day), Tof (40 mg/kg/day), Fed (60 mg/kg/day), or Ita (30 mg/kg/day) by daily i.p. injections for 5 days (n = 5 for Adarfl/fl, n = 8 for AdariΔgut, n = 5 for AdariΔgut+Rux, n = 4 for AdariΔgut+Tof, n = 7 for AdariΔgut+Fed, n = 4 for AdariΔgut+Ita). c H&E staining of intestine and colon sections. Scale bars: 100 μm. Shown on the right are quantifications of histopathological scores and on the lower left are quantifications of lengths of ileal crypts and villi (n = 5 for Adarfl/fl, n = 5 for AdariΔgut, n = 5 for AdariΔgut+Rux, n = 4 for AdariΔgut+Tof, n = 5 for AdariΔgut+Fed, n = 4 for AdariΔgut+Ita). PC proximal colon, DC distal colon. d Representative images of TUNEL staining (green) on the ileal sections. Scale bars: 100 μm. e Immunofluorescence of E-cadherin (red). Scale bars: 100 μm. f Immunofluorescence of Lysozyme (green) and Muc2 (red). Scale bars: 100 μm. G Western blot analysis of ileal samples. The relative values of protein expression are labeled (n = 3). Data are presented as the mean ± SEM. The statistical significance was analyzed using Log-rank (Mantel-Cox) test (Fig. 7b). The remaining statistical differences were determined using one-way ANOVA with multiple comparisons. Source data are provided in the Source data file.
Fig. 8
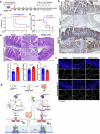
Fig. 8. Characterization of ADARN173S as a loss function mutation that may have triggered bowel inflammation in patients and mice.
a The scheme of overexpressing WT human ADAR or ADARN173S in the gut of AdariΔgut mice by infecting the mice with adeno-associated viruses 8 (AAV8) for 5 weeks under the control of the gut-specific GC-C promoter and then treated with TMX to induce the knockout of the endogenous Adar. b Representative immunohistochemical staining of Adar in intestine and colon sections. Scale bars: 100 μm. c Survival curves after tamoxifen treatment (n = 11 for AAV-hADAR, n = 12 for AAV-hADARN173S). d Relative body weight (n = 9 for AAV-hADAR, n = 10 for AAV-hADARN173S). e H&E staining of intestine and colon sections. Scale bars: 100 μm. Shown below are the quantifications of histopathological scores, and lengths of ileal crypts and villi (n = 5 for AAV-hADAR, n = 4 for AAV-hADARN173S). f Representative images of J2 staining (green) on the ileum and colon sections. Scale bars: 100  μm. g Summary of ADAR loss-of-function triggered spontaneous IBD through the intestinal ADAR-ERVs/dsRNA-MDA5-IFNγ-JAK/STAT axis. Pharmacological inhibition of JAK1/2 by Ruxolitinib attenuated IBD in Adar-deficient mice. Summary model of ADAR in IBD created in BioRender. Xu, M. (2025) https://BioRender.com/ad9fbmq. Data are presented as the mean ± SEM. The statistical significance was analyzed using Gehan-Breslow-Wilcoxon test (Fig. 8c). The remaining statistical differences were determined using unpaired two-tailed t-test. Source data are provided in the Source data file.

References

    1. Jairath, V. & Feagan, B. G. Global burden of inflammatory bowel disease. Lancet Gastroenterol. Hepatol.5, 2–3 (2020). - PubMed
    1. Collaborators, G. B. D. I. B. D. The global, regional, and national burden of inflammatory bowel disease in 195 countries and territories, 1990-2017: a systematic analysis for the Global Burden of Disease Study 2017. Lancet Gastroenterol. Hepatol.5, 17–30 (2020). - PMC - PubMed
    1. Qiu, Y. et al. Disease burden of inflammatory bowel disease in China from 1990 to 2017: findings from the global burden of diseases 2017. EClinicalMedicine27, 100544 (2020). - PMC - PubMed
    1. Baumgart, D. C. & Carding, S. R. Inflammatory bowel disease: cause and immunobiology. Lancet369, 1627–1640 (2007). - PubMed
    1. Na, Y. R., Stakenborg, M., Seok, S. H. & Matteoli, G. Macrophages in intestinal inflammation and resolution: a potential therapeutic target in IBD. Nat. Rev. Gastroenterol. Hepatol.16, 531–543 (2019). - PubMed

MeSH terms

LinkOut - more resources