. 2025 Sep 29;16(1):8561.
doi: 10.1038/s41467-025-63529-5.

Prolonged glucagon exposure rewires lipid oxidation and drives diabetic kidney disease progression

Affiliations

Prolonged glucagon exposure rewires lipid oxidation and drives diabetic kidney disease progression

Xingfeng Liu et al. Nat Commun. .

Abstract

Diabetic kidney disease (DKD) is the leading cause of end-stage kidney disease. Tubular abnormalities may precede glomerular pathology and indicate functional progression of DKD. Here, we find glucagon injection exacerbates lipid accumulation and renal injury, in addition to causing morphological changes in proximal tubules, podocytes, and mitochondria in the early phase of DKD in mice. However, the specific knockdown or knockout of Gcgr in renal tubular epithelial cells almost completely halts DKD development. In contrast to the effect of short-term glucagon stimulation, long-term glucagon exposure leads to the reversal of glucagon action (glucagon reversal) in proximal tubular epithelial cells (PTECs), which is characterized by reduced energy production and an increase in lipogenesis through Gcgr-PKA-Creb-mTORC1 pathway. Accordingly, anti-GCGR antibody treatment strongly blocks the pathogenesis of DKD induced by both type 2 and type 1 diabetes. Thus, our results highlight a previously unrecognized role of glucagon/Gcgr signaling in PTEC lipogenesis and DKD.


Conflict of interest statement

Competing interests: Hai Yan is an employee in and holding shares of REMD Biotherapeutics stock.

Figures

Fig. 1
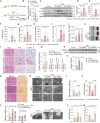
Fig. 1. Glucagon and Gcgr were elevated in DKD mice.
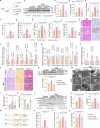
a Serum glucagon levels in 15-week-old male db/db mice at different time points. b Schematic of UniX-HFD/STZ-induced DKD mouse model: 6-week-old male C57BL6/J mice received HFD for 4 weeks, followed by uninephrectomy, then STZ injection to induce diabetes after 2-week recovery. c Serum glucagon levels in control and DKD mice (16 weeks post-STZ injection). d, e Gcgr protein levels in liver, muscle, eWAT, and kidney of 8-week-old male mice on normal chow. f, g Western blot analysis of renal Gcgr in DKD mice (8 weeks post-STZ). h Co-immunofluorescence of Gcgr with renal cell markers (AQP1 for proximal tubule, LTL for proximal tubules, calbindin-D28K for distal tubules, α-SMA for mesangial cell and podocin for podocytes) in the normal chow-fed C57BL6/J mice (male, 8-week-old). Scale bar: 50 μm. i Schematic of glucagon injection protocol: 300 nmol/kg glucagon i.p. twice daily for 2 weeks starting 1 week after STZ. jn Serum glucagon, UACR, urine Kim-1 (normalized to creatinine), 24-h urine volume, and kidney weight/body weight ratio. Samples were collected after 2 weeks of glucagon injections. The error bars represent the SEMs; n = 3–6 in each group (a, cg) and 5-12 in each group (jn). UniX, uninephrectomized; HFD, high-fat diet; STZ, streptozotocin; UACR, urinary albumin-to-creatinine ratio; Kim-1, kidney injury molecule-1.
Fig. 2
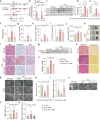
Fig. 2. Gcgr-specific knockdown in kidney tubules halted DKD progression.
a Schematic of UniX-HFD/STZ-DKD mouse model with in situ AAV-shRNA injection: modeling as in Fig. 1b, AAV-shRNA injected into kidneys 4 weeks post-STZ injection, sacrificed 4 weeks later. b Gcgr mRNA levels in primary PTECs from control and Gcgr shRNA-injected mice. ce Renal Gcgr, p-Creb, total Creb protein levels. fh UACR, urine Kim-1/creatinine, NAG/creatinine in the indicated groups of mice. i 24 h urine volume in the indicated groups. j, k Kidney weight-to-body weight ratio and kidney morphology in the indicated groups. l H&E, Oil Red O and PAS staining of kidneys from the mice with or without Gcgr knockdown. Scale bar: 50 μm. m Relative mRNA levels of inflammatory genes in the kidneys in the indicated groups. no Renal Collagen I protein in the indicated groups. p Masson and Sirius red staining. Scale bar: 50 μm. q TEM analyses of kidney proximal tubules. Scale bar: white: 5 μm; yellow: 2 μm; red: 1 μm. Yellow arrow: lipid droplet. Quantitative analysis of the length (r) and number per cell (s) of mitochondria. t Relative mRNA levels of Dpr1 and Mfn1 in the kidneys of mice. u TEM analyses of kidney glomeruli. Scale bar: 5 μm. White arrows: GBM; red asterisk: podocyte fusion. Quantitative analysis of the GBM width (v) and foot process width (w). Mice were male and sampled after 4 weeks of shRNA injections (bv). The error bars represent the SEMs; n = 3 in each group (ce, no), 4-6 in the control group and 12-20 in the shRNA group (b, fj, m, rt, vw). NAG, N-acetyl-beta-D-glucosaminidase; GBM, glomerular basement membrane. TEM, transmission electron microscopy. PTECs, proximal tubular epithelial cells.
Fig. 3
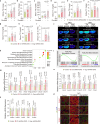
Fig. 3. Renal tubule-specific Gcgr knockout ameliorated renal injury in DKD mice.
a Schematic of CRISPR/Cas9 constructs targeting Gcgr locus before/after Cre recombination. b Gcgr mRNA levels in primary PTECs and kidneys of 6-wk-old male Gcgrfl/fl and Gcgrfl/flKspCre mice on Normal Chow. ce Renal Gcgr, p-Creb, total Creb protein via western blot. fh UACR, urine Kim-1/creatinine, NAG/creatinine in different groups of mice. i 24 h urine volume in the indicated groups. jk Kidney weight/body weight ratio and macro renal morphology in the indicated groups. l Kidney H&E, Oil Red O, PAS staining in the Gcgrfl/fl and Gcgrfl/flKspCre groups. Scale bar: 100 μm. mn Renal Collagen I protein levels in kidneys from different groups of mice. o Masson and Sirius red staining of renal lesions in the Gcgrfl/fl and Gcgrfl/flKspCre groups. Scale bar: 100 μm. p TEM analyses of kidney proximal tubules. Scale bar: yellow: 5 μm; red: 2 μm; orange: 500 nm. Yellow arrow: lipid droplet. Quantitative analysis of the number of mitochondria per cell (q) and length of mitochondria (r). s TEM analyses of kidney glomeruli. Scale bar: 1 μm. White arrows: GBM; red asterisk: podocyte fusion. tu Quantitative analysis of the GBM width and foot process width in the indicated groups. Mice were male and sampled after 8 weeks of STZ injections (cp). The error bars represent the SEMs; n = 3 in each group (ce, mn), 5-9 in each group (b, fj, q) and 12-15 in each group (r, t and u).
Fig. 4
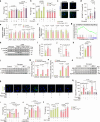
Fig. 4. Glucagon led to lipid accumulation in the kidney under DKD conditions.
ad Renal triglyceride (TG, a)/total cholesterol (TC, b) and serum TG (c)/TC (d) levels in Glucagon-injected mouse groups. Renal TG (e)/TC (f) and serum TG (g)/TC (h)/low-density lipoprotein cholesterol (LDL-C, i) levels following renal Gcgr knockdown. j AFADESI-MSI-based spatially resolved lipidomic analysis of kidney tissues from the control, Ctrl shRNA and Gcgr shRNA groups. k The top 10 (ranked by padj) Gene Ontology terms upregulated in the kidneys of mice in the Gcgr shRNA group compared to the Ctrl shRNA group. l Gene set enrichment shows lipid synthesis pathway enrichment and fatty acid oxidation deficiency in Ctrl shRNA vs. Gcgr shRNA kidneys. m-o Renal mRNA expression of lipid biosynthesis/esterification/transport genes (mn) and fatty acid oxidation genes (o) in different groups. p Immunofluorescence co-localization of LTL (green) with Srebp1/Scd1/Srebp2 (red) in kidney sections. Scale bar: 50 μm. Mice were male and sampled after 2 weeks of glucagon injections (ad), mice were male and sampled after 8 weeks of STZ injections (ei, mo), and mice were male and sampled after 4 weeks of shRNA injections (jl, p). The error bars represent the SEMs; n = 5–12 in each group (ai) and 4-9 in each group (m-o). TG, triglyceride; TC, total cholesterol; padj, adjusted p value.
Fig. 5
Fig. 5. Long-term glucagon treatment promoted lipid accumulation by activating mTORC1 signaling.
a Intracellular TG in HK2 cells treated with 100 nM glucagon for different durations. b Intracellular TG in primary PTECs from Gcgrfl/fl and Gcgrfl/flKspCre mice treated with 100 nM glucagon for 24 h using 5 μM PA as a substrate. cd BODIPY staining of HK2 cells under identical conditions. Scale bar: 20 μm. ef qRT-PCR analyses of the lipogenesis and fatty acid oxidation genes in HK2 cells after 48 h glucagon treatment. g GSEA shows mTORC1 signaling enrichment in Ctrl shRNA vs. control kidneys. hj Western blot of p-mTORC1, p-S6 in kidneys (8 wk post-STZ). k Intracellular cAMP in HK2 cells during glucagon treatment. l p-CREB western blot in HK2 cells. m ChIP-qPCR analysis using an anti-CREB antibody. n Luciferase assay of Rraga/S6k promoters in HepG2 cells. o Western blot of S6K/S6 in HK2 cells. ps BODIPY staining and TG measurement in HK2 cells with PKA/mTORC1 inhibitors. Scale bar: 20 μm. t PTECs derived from Gcgrfl/fl and Gcgrfl/flKspCre mice were treated with 10 μM MHY1485 (an mTORC1 activator) for 24 h, and the intracellular TG was subsequently measured. Mice were male and sampled after 4 weeks of shRNA injections (g), and mice were male and sampled after 8 weeks of STZ injections (hj). The error bars represent the SEMs; n = 3-8 biologically independent cells (af, ln, qt); n = 3 in each group (hk, o). PA, palmitate acid; BODIPY, boron-dipyrromethene.
Fig. 6
Fig. 6. Long-term glucagon treatment promoted mitochondrial dysfunction.
a ATP/ADP ratio in HK2 cells treated with 100 nM glucagon for varying durations. b Fatty acid oxidation of NRK-52E cells: NRK-52E cells were pretreated with 100 nM glucagon for 24 h or 1 h before the assay, and then, palmitate substrate was added to the wells just before measuring the OCR. Where indicated, etomoxir (4 μM, inhibitor of CPT1), oligomycin (2.5 μM, inhibitor of ATP synthase), FCCP (2 μM, uncoupler of oxidative phosphorylation) and antimycin/rotenone (0.5 μM, inhibitors of respiratory complex) were added. c Basal respiration, maximal respiration, ATP production and respiration capacity were calculated from the OCR in NRK-52E cells. d Images of live mitochondria stained with PKMO in NRK-52E cells. Scale bar: 2 μm. e Mitochondrial superoxide (MitoSOX, red) staining of HK2 cells treated with 100 nM glucagon and 50 μM PA for the indicated period. Scale bar: 100 μm. fh Representative western blot and quantification of fibronectin and phosphorylated and total S6 in HK2 cells treated with high glucose (30 mM) or 100 nM glucagon with or without the PKA inhibitor H89 (10 μM). ik Representative western blot and quantification of fibronectin and phosphorylated and total S6 in HK2 cells treated with high glucose (30 mM) or 100 nM glucagon with or without the mTOR inhibitor rapamycin (30 nM). The error bars represent the SEMs; n  = 3-8 biologically independent cells (ak). OCR, oxygen consumption rate; FN1, fibronectin.
Fig. 7
Fig. 7. GCGR mAb treatment improved DKD.
a GCGR mAb treatment protocol for DKD mice: modeled as in Fig. 1b, 5 mg/kg GCGR mAb i.p. injected for 5 week starting 4 week post-STZ, sacrificed 5 week later. bc Renal p-Creb/total Creb by western blot. dg UACR, 24-h urine volume, urine Kim-1/NAG/creatinine in the indicated groups of mice. hj TG and TC levels in the kidney cortex and serum of mice in the indicated groups. k Kidney H&E/Oil Red O staining. Scale bar: black, 100 μm; yellow, 500 μm. ln qRT‒PCR analyses of the key genes related to lipogenesis, fatty acid oxidation, and lipid transport. o Renal Masson/Sirius red/PAS staining. Scale bar: 100 μm. p Western blot and quantification of Collagen I in the kidneys. q TEM analyses of kidney glomeruli and proximal tubules in the kidney cortex. Scale bar: white, 2 μm; red, 5 μm. r-sGBM width and number of mitochondria. tv Renal p-mTORC1/p-S6 levels. w GCGR mAb protocol for type 1 diabetic DKD rats: 6-week-old male Sprague‒Dawley rats were intraperitoneally injected with 65 mg/kg STZ, and 4 weeks after STZ injection, 5 mg/kg GCGR Ab was i.p. injected once a week for 7 weeks. x Urine protein levels in rats in the different groups. yz Serum creatine and BUN levels in rats in the different groups. Mice were male and sampled after 5 weeks of GCGR mAb injection (bv), and rats were male and sampled after 7 weeks of GCGR mAb injection (xz). The error bars represent the SEMs; n = 4-10 in each group (dj, ln, s, xz); n = 3 in each group (b, c, p, sv). BUN, blood urea nitrogen.

References

    1. Chen, Y., Lee, K., Ni, Z. & He, J. C. Diabetic kidney disease: challenges, advances, and opportunities. Kidney Dis.6, 215–225 (2020). - PMC - PubMed
    1. Alicic, R. & Nicholas, S. B. Diabetic kidney disease back in focus: management field guide for health care professionals in the 21st century. Mayo Clin. Proc.97, 1904–1919 (2022). - PubMed
    1. Groth, T. et al. Wearable and implantable artificial kidney devices for end-stage kidney disease treatment: current status and review. Artif. Organs47, 649–666 (2023). - PubMed
    1. Fioretto, P. & Mauer, M. Histopathology of diabetic nephropathy. Semin Nephrol.27, 195–207 (2007). - PMC - PubMed
    1. Mauer, S. M. et al. Structural-functional relationships in diabetic nephropathy. J. Clin. Investig.74, 1143–1155 (1984). - PMC - PubMed

MeSH terms

Substances

LinkOut - more resources