. 2025 Sep 29;16(1):8571.
doi: 10.1038/s41467-025-63610-z.

HIV vaccine candidate ΔV1gp120 formulated in ALFQA adjuvant augments mucosal immunity in female macaques

Affiliations

HIV vaccine candidate ΔV1gp120 formulated in ALFQA adjuvant augments mucosal immunity in female macaques

Massimiliano Bissa et al. Nat Commun. .

Abstract

Simian or Human immunodeficiency virus (SIV or HIV) vaccines based on V1-deleted envelope virus-like particles, delivered by the DNA/ALVAC platforms, followed by the ΔV1gp120 boost formulated in Alum, protect 50% and 80% of macaques from mucosal infection with SIVmac251 or Simian-Human immunodeficiency virus, respectively. Adding the Army Liposome Formulation + QS21 (ALFQ) adjuvant to the ΔV1gp120+Alum boost (ALFQA) may enhance protective immune responses. Here, we show that ALFQA protects 58% of female macaques from infection following eleven exposures to SIVmac251, achieving 79% vaccine efficacy. The ALFQA vaccine regimen augments mucosal CD73+CD163+ M2-like macrophages and NKp44+ innate lymphoid cells (ILCs), while reducing NKG2A-NKP44- cells producing interferon-γ. Antibody-Dependent Cellular Cytotoxicity (ADCC) targeting helical V2, and mucosal tolerogenic dendritic cells-10 (DC-10) and envelope-specific interleukin-17+ NKp44+ ILCs, correlate with decreased risk of infection. Plasma proteome analysis links vaccine efficacy to lymphotoxin-α, mucosal DC-10, and chemokine (C-C motif) ligand-8, a chemokine produced mainly by M2-macrophages. These data support the role of pro-resolution immunity in protection afforded by the V1-deleted SIV and HIV immunogens. The Combined Long-term Efferocytosis and ADCC Responses (CLEAR) phase I HIV-vaccine trial is designed to test the safety and immunogenicity of the Alum and ALFQA adjuvants in combination with V1-deleted HIV immunogens in humans.


Conflict of interest statement

Competing interests: The authors declare no competing interests.

Figures

Fig. 1
Fig. 1. Study design, vaccine efficacy, and viral load.
a Schematic study design of Alum (blue) and ALFQA (red) immunized groups with immunization schedule (weeks 0–12) and SIVmac251 intravaginal challenges (weeks 17-27). bd SIVmac251 acquisition. The number of intravaginal exposures before infection was assessed in b Alum (n = 30) and c ALFQA (n = 12) animals relative to control (n = 37) animals, or d between Alum and ALFQA animals (Log-rank Mantel–Cox test). e Log10 Simian immunodeficiency virus (SIV) RNA levels in plasma over time following SIVmac251 infection (weeks; geometric mean with error and 95% CI) in Alum (n = 20), ALFQA (n = 5), and control (n = 26) animals. P values indicate a two-tailed Mann–Whitney U comparison test between the Alum (blue p values) or ALFQA (red p values) groups and the control group. Alum, ALFQA and control animals are depicted in blue, red, and black, respectively. Source data are provided as a Source Data file.
Fig. 2
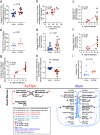
Fig. 2. Antibody responses, Fc receptor-dependent function of antibodies, and efferocytosis.
a Antibody response (optical densities, OD) to peptide 26 (variable region 2) in Alum (n = 30) and ALFQA (n = 12) animals at weeks 14–17. b Correlation between antibody response to peptide 26 and Log10 plasma avidity score of antibodies to the cyclic V2 region of SIVmac251 in alum (n = 9) and ALFQA (n = 10) animals at weeks 14–17. c Mucosal (vaginal secretions) antibody titers targeting the whole ΔV1gp120 protein of SIVm766 in Alum (n = 30) and ALFQA (n = 12) animals at weeks 14–16. d Correlations between V2-specific antibody-dependent cellular cytotoxicity (ADCC; NCI05 antibody) against gp120-coated cells and the time of acquisition (TOA) in alum (n = 30) and ALFQA (n = 12) animals at weeks 17. eg Vaccine-induced change (week 14/15 – baseline) of e trogocytosis score, f antibody-dependent cellular phagocytosis (ADCP), and g antibody-dependent neutrophil phagocytosis (ADNP) against SIVm766 ΔV1gp120 protein measured in plasma of alum (n = 12) and ALFQA (n = 12) animals. h Vaccine-induced change (week 14/15 – baseline) of ADNP against SIVm766 wild-type gp120 protein measured in plasma of alum (n = 12) and ALFQA (n = 12) animals. i Correlation between vaccine-induced change (week 14/15 – baseline) ADNP against SIVm766 ΔV1gp120 protein measured in plasma and Time of acquisition (TOA) in Alum (n = 12) and ALFQA (n = 12) animals. j, k Vaccine-induced changes (week 13 – baseline) of j the frequency of CD14+ efferocytes and k their engulfing capability of apoptotic neutrophils in the blood of alum (n = 6) and ALFQA (n = 12) animals. l Schematic summarizing Spearman correlations among systemic antibody responses and functions in ALFQA animals (left) and Alum (right) animals. Associations of p < 0.05 are shown with a thin line, and p < 0.01 with a thicker line connecting variables. Associations found in both Alum and ALFQA are shown in black. Associations found only in ALFQA or Alum animals are in red or blue, respectively. Double-headed arrows indicate Spearman R > 0, vertical stubs indicate Spearman R < 0. Mann–Whitney p < 0.05 direction between groups is indicated by the vertical block arrows. Positive Spearman correlation with TOA p < 0.05 is depicted with purple text. Comparisons: a, c, eh, j, k two-tailed Mann–Whitney U-test with median; Correlations: b, d, i two-tailed Spearman correlation with simple linear regression. Alum animals and correlations are depicted in blue, ALFQA animals and correlations are depicted in red. In panels ak, SIV-immunized Alum and ALFQA animals are depicted as black circles filled in blue and red, respectively. Source data are provided as a Source Data file.
Fig. 3
Fig. 3. Mucosal vaccine-induced immune responses.
a Vaccine-induced change (week 13 – baseline) of the frequency of mucosal CD73+CD163+ macrophages in rectum of Alum (n = 12) and ALFQA (n = 12) animals. b Correlation between vaccine-induced change (week 13 – baseline) of rectal CD73+CD163+ macrophages and the frequency of CD14+ efferocytes at week 13 in ALFQA (n = 12) animals. c Correlation of the vaccine-induced change (week 13 – baseline) of the frequency of mucosal DC-10 in rectum and the time of acquisition (TOA) in ALFQA (n = 12) animals. d Frequency of mucosal CD73+CD163+ macrophages in rectum of Alum (n = 6) and ALFQA (n = 6) HIV-vaccinated animals (week 13). e Vaccine-induced change (week 13 – baseline) of the frequency of mucosal NKp44+ innate lymphoid cells (ILCs) in rectum of Alum (n = 12) and ALFQA (n = 12) animals. f Correlation of the vaccine-induced change (week 13 – baseline) of the frequency of NKp44+ ILCs in rectum and TOA in ALFQA (n = 12) animals. g Correlation of the vaccine-induced change (week 13 – baseline) of the frequency of rectal IL-17-producing NKp44+ ILCs following stimulation with gp120 protein and TOA in ALFQA (n = 12) animals. h Vaccine-induced change (week 13 – baseline) of the frequency of rectal IFN-γ-producing NKG2A-NKp44- ILCs following stimulation with PMA of Alum (n = 12) and ALFQA (n = 12) animals. i Frequency of mucosal NKp44+ ILCs in rectum of Alum (n = 6) and ALFQA (n = 6) HIV-vaccinated animals (week 13). j Schematic summarizing Spearman correlations among mucosal cell populations in ALFQA animals (left) and alum (right) animals. Associations of p < 0.05 are shown with a thin line, and p < 0.01 with a thicker line connecting variables. Associations found in both Alum and ALFQA are shown in black. Associations found only in ALFQA or Alum animals are in red or blue, respectively. Double-headed arrows indicate Spearman R > 0, vertical stubs indicate Spearman R < 0. Two-tailed Mann–Whitney p < 0.05 direction between groups is indicated by the vertical block arrows. Positive Spearman correlation with TOA p < 0.05 is depicted with purple text. Comparisons: a, d, e, h, i, two-tailed Mann–Whitney U- test with median; Correlations: b, c, f, g, two-tailed Spearman correlation with simple linear regression. Alum animals are depicted in blue, ALFQA animals are depicted in red. In ac, eh, SIV-immunized alum and ALFQA animals are depicted as black circles filled in blue and red, respectively. In d, i, HIV-immunized Alum and ALFQA animals are depicted as empty circles with blue and red borders, respectively. Source data are provided as a Source Data file.
Fig. 4
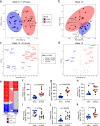
Fig. 4. ALFQA and alum-induced cytokine and chemokine milieu.
a, b Principal component analysis (PCA) of absolute levels (pg/ml) of cytokines, chemokines and other proteins measured in plasma collected at (a) week 12 + 24 h and b week 13 from alum (n = 17 at week 12 + 24 h and n = 12 at week 13) and ALFQA (n = 12 at both timepoints) animals. Arrows indicate the top drivers (loadings) for PC1 and PC2. c, d Volcano plots summarizing two-tailed Mann–Whitney differences in the plasma proteome between alum and ALFQA groups at c week 12 + 24 hs and d week 13 from Alum (n = 17 at week 12 + 24 h and n = 12 at week 13) and ALFQA (n = 12 at both timepoints) animals. The x-axis indicates the difference between the medians of each target level for each group, while the y-axis indicates the −log10 (p values) of the ALFQA vs alum comparisons. Unadjusted p values are reported. The x-axis values are calculated as log10 (absolute value (median of outer differences)) * sign of median of outer differences, as described in the methods. Only targets significantly different between the groups (p < 0.05) are labeled. Targets higher in the ALFQA group are marked in red, whereas targets higher in the Alum group are marked in blue. e Alluvial diagram summarizing the pattern of two-tailed Mann–Whitney significance (p < 0.05) over time. Targets that differ between the groups at baseline have been omitted. At each timepoint, targets are colored according to their direction of Mann–Whitney difference p < 0.05. Alluvial flow between the timepoints connect the same target at week 12 + 24 h and week 13 and are colored according to their pattern at week 12 + 24 h. (fk) Absolute levels (pg/ml) of C-C motif chemokine ligand 2 (CCL2) at f week 12 + 24 h and i week 13, Interleukin 18 (IL-18) at g week 12 + 24 h and h week 13, and Lymphotoxin-alpha (LTA) at j week 12 + 24 h and k week 13, in plasma of Alum (n = 17 at week 12 + 24 h and n = 12 at week 13) and ALFQA (n = 12 at both timepoints). Comparisons: fk two-tailed Mann–Whitney U-test with median. In panels a, b and fk, SIV-immunized alum and ALFQA animals are depicted as black circles filled in blue and red, respectively. Source data are provided as a Source Data file.
Fig. 5
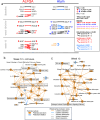
Fig. 5. Associations among biomarkers and ALFQA-induced proteome pathways.
a Schematic summarizing Spearman correlations among plasma proteome biomarkers in ALFQA (left) and alum (right) animals. Associations with p < 0.001 are indicated. Associations found in both Alum and ALFQA are shown in black. Associations found only in ALFQA or alum animals are in red or blue, respectively. Double-headed arrows indicate Spearman R > 0; there are no negative associations at this threshold. Two-tailed Mann–Whitney p < 0.05 direction between groups is indicated by vertical block arrows. Association with time of acquisition (TOA) p < 0.05 is depicted with purple text. b, c Graphical summaries of major biological themes identified by ingenuity pathway analysis (IPA) of ALFQA-induced proteome at b week 12 + 24 hours (alum n = 17 and ALFQA n = 12) and c week 13 (Alum n = 12 and ALFQA n = 12), compared to alum. Red and blue boxes indicate predicted activation and predicted inhibition, respectively; whereas red and blue lines indicate relationships that lead to activation and inhibition, respectively. Source data are provided as a Source Data file.
Fig. 6
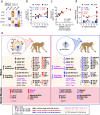
Fig. 6. Targets associated with decreased risk and hypothetical mechanisms of vaccine efficacy.
a Heatmap summarizing the significant two-tailed Spearman correlations between the absolute levels (pg/ml) of epidermal growth factor (EGF), Interleukin 17 F (IL-17F), C-C motif chemokine ligand 8 (CCL8), C-X-C motif chemokine ligand 8 (CXCL8), and lymphotoxin-alpha (LTA) measured in plasma collected at week 12 + 24 h from ALFQA (n = 12) and alum (n = 17) animals, and at week 13 from ALFQA (n = 12) and alum (n = 12) animals, and time of acquisition (TOA). The ρ-values are identified by the color-scale, while the significant correlations (p < 0.05) are identified by asterisks. Reported p values are unadjusted for multiple comparisons. b, c Correlation of the absolute level (pg/ml) of plasma LTA at week 13 with b TOA in ALFQA (n = 12) or alum (n = 12) animals or c the vaccine-induced change (week 13 – baseline) of the frequency of rectal DC-10 in ALFQA (n = 12) animals (paired data not available in alum-treated animals). d Correlations of the absolute level (pg/ml) of plasma CCL8 at week 12 + 24 h with TOA in alum (n = 17) and ALFQA (n = 12) animals. e Schematic representation of immune responses contributing to vaccine efficacy at the systemic and mucosal levels and their comparison between ALFQA (left) and Alum (right) groups. In peripheral blood, the immunization with ΔV1DNA/ALVAC and ΔV1gp120 protein boost adjuvanted in ALFQA induces antibodies to gp120 mediating ADCC, and, when compared to Alum, higher ADCP and ADNP, together with higher CD14+ efferocytes. In the ALFQA group, vaccination induces higher levels of LTA and other cytokines/chemokines. LTA in plasma induces mucosal tolerogenic DC-10, toward a protective phenotype. Together with increased anti-inflammatory CD73+CD163+ macrophages and ILCs that express NKp44+ and maintain tissue-homeostasis, DC-10 favors the killing and clearance of SIV-infected apoptotic cells, preventing the recruitment of CD4+ target T cells. The figure contains images (monkeys and immunogens) created in BioRender. Woode, E. (2025) https://BioRender.com/p4mqsnf. Correlations: bd two-tailed Spearman correlation with simple linear regression. Alum animals and correlations are depicted in blue, ALFQA animals and correlations are depicted in red. Source data are provided as a Source Data file.

References

    1. Hou, Y. et al. Advanced subunit vaccine delivery technologies: from vaccine cascade obstacles to design strategies. Acta Pharm. Sin. B13, 3321–3338 (2023). - PMC - PubMed
    1. Francis, M. J. Recent advances in vaccine technologies. Vet. Clin. North Am. Small Anim. Pr.48, 231–241 (2018). - PMC - PubMed
    1. Sarkar, I., Garg, R. & van Drunen Littel-van den Hurk, S. Selection of adjuvants for vaccines targeting specific pathogens. Expert Rev. Vaccines18, 505–521 (2019). - PMC - PubMed
    1. Verma, S. K. et al. New-age vaccine adjuvants, their development, and future perspective. Front. Immunol.14, 1043109 (2023). - PMC - PubMed
    1. Awate, S., Babiuk, L. A. and Mutwiri, G. Mechanisms of action of adjuvants. Front. Immunol.4, 114 (2013). - PMC - PubMed

MeSH terms