. 2025 Sep 29;16(1):8572.
doi: 10.1038/s41467-025-63592-y.

In vivo CRISPR screening in head and neck cancer reveals Uchl5 as an immunotherapy target

Affiliations

In vivo CRISPR screening in head and neck cancer reveals Uchl5 as an immunotherapy target

Cong Fu et al. Nat Commun. .

Abstract

Recurrent/metastatic head and neck squamous cell carcinoma (HNSCC) is an aggressive malignancy with a significant unmet need for enhancing immunotherapy response given current modest efficacy. Here, we perform an in vivo CRISPR screen in an HNSCC mouse model to identify immune evasion genes. We identify several regulators of immune checkpoint blockade (ICB) response, including the ubiquitin C-terminal hydrolase 5 (UCHL5). Loss of Uchl5 in tumors increases CD8+ T cell infiltration and improved ICB responses. Uchl5 deficiency attenuates extracellular matrix (ECM) production and epithelial-mesenchymal-transition (EMT) transcriptional programs, which contribute to stromal desmoplasia, a histologic finding we describe as associated with reduced anti-PD1 response in human HNSCCs. COL17A1, a collagen highly and specifically expressed in HNSCC, mediates in part Uchl5-mediated immune evasion. Our findings suggest an unappreciated role for UCHL5 in promoting EMT in HNSCC and highlight ECM modulation as a strategy to improve immunotherapy responses.


Conflict of interest statement

Competing interests: R.T.M. receives research funding from Calico Life Sciences, LLC. R.T.M. has received speaking or consulting fees from Bristol Myers Squibb, Gilead Sciences, Kumquat Biosciences, Immunai Therapeutics, and BioNTech. R.U. reports grants and personal fees from Merck, personal fees from Regeneron, and Daichi-Sankyo. The MOC models developed by R.U. have been filed with the Washington University Office of Technology Management and are licensed for distribution by Kerafast. The remaining authors declare no competing interests.

Figures
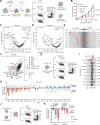
Fig. 1
Fig. 1. A head and neck cancer in vivo CRISPR screen identifies epigenetic regulators of tumor immunity.
A Schematic for in vivo epigenome-wide CRISPR screening using the SCAR system and screen design, created in BioRender. B Tumor volume over time for SCAR-vector-system-library-transduced MOC1-esc1 cells in NSG, WT untreated, and anti-PD-1- and anti-CTLA-4-treated C57BL/6 mice (n = 40 mice per group). C, D Volcano plots illustrating the comparison of ICB-treated wild-type and untreated (C) or NSG (D) mice with genes whose knockout (KO) can enhance (red) or inhibit (blue) sensitivity to combination of anti-PD-1 and anti-CTLA-4 treatment. E Histograms showing guide performance relative to library distribution for some top depleted or enriched genes in ICB-treated versus NSG animals. F Depletion (negative ratios) of targeted genes in ICB-treated wild-type versus NSG mice compared to ICB-treated versus untreated wild-type. HIRA, INO80, TFIID, SIN3, EP300, E3 ligase or Deubiquitinating enzymes and positive control genes highlighted. G Schematic of validation pool screen, figure created in BioRender. H Calculated log2 fold change in the ratio of tumor cells with sgRNAs targeting selected genes in the validation pool versus control sgRNA within MOC1-esc1 tumors treated with anti-PD1 normalized to the ratio for tumors implanted in NSG mice, n = 5 mice each. Genes whose knockout (KO) can enhance (red) or inhibit (blue) sensitivity to anti–PD1 treatment. I Histograms showing guide performance relative to library distribution for Uchl5 gene in ICB-treated versus NSG animals across different tumor models. J Schematic for tumor growth competition, created in BioRender. K Calculated log2 fold changes of Uchl5 versus control sgRNA barcode abundance is plotted on the y-axis, where negative values represent the depletion of Uchl5 sgRNAs, n = 6 tumors for NSG and PD1 treated groups, 10 tumors for untreated WT group, data are representative of four independent experiments. Data in B were calculated by two-way ANOVA represented as mean ± s.d. The -log P-values as in F were calculated by two-sided hypergeometric test. Data in H and K were analyzed by unpaired, two-sided Student’s t-test and are represented as mean ± s.d. Source data are provided as a Source Data file.
Fig. 2
Fig. 2. Uchl5 deficiency in tumors enhances sensitivity to anti-PD1 treatment.
A Tumor growth curves in mice challenged with control and Uchl5-deficient MOC1-esc1 tumor cells in NSG and WT C57BL/6 mice. Mice were either without treatment (NSG, no treatment; WT, no treatment) or treated with anti-PD1 or combination of anti-PD1 and anti-CTLA4. Timing of monotherapy and combination therapy were indicated with orange arrows and pink arrows, respectively, n = 6 tumors for NSG group, 10 tumors for WT group. B Survival of the mice challenged with control and Uchl5-deficient MOC1-esc1 tumor cells in NSG and WT C57BL/6 mice with or without treatment. Endpoint: tumor size 2000 mm3. Data in A and B are representative of three independent experiments, and the comparisons are between Uchl5-deficient and control MOC1-esc1 tumor cells. C Schematic of the tumor rechallenge experiment. D Uchl5-deficient tumor-challenged mice cured with anti-PD1 treatment were re-challenged with parental MOC1-esc1 tumor cells. Naive WT mice were shown in gray (n = 5 tumors) and cured mice were shown in red (n = 12 tumors). E Tumor growth curves in mice orthotopically challenged with control and Uchl5-deficient 4MOSC1 tumor cells in NSG and WT C57BL/6 mice with or without anti-PD1, n = 6 (Ctrl sgRNA) and 7 (Uchl5 sgRNAs) tumors for NSG groups, 9 tumors for control WT group, 8 tumors for Uchl5 KO untreated group, 10 tumors for Uchl5 KO PD1 treated group, data are representative of two independent experiments, created in BioRender. F Survival of the mice orthotopically challenged with control and Uchl5-deficient 4MOSC1 tumor cells in NSG and WT C57BL/6 mice with or without treatment. Endpoint: tumor length exceeding 8 mm. Data in A, D, and E were calculated by two-way ANOVA represented as mean ± s.e.m., and data in B and F were analyzed with a Log-rank (Mantel-Cox) test. Source data are provided as a Source Data file.
Fig. 3
Fig. 3. Tumor cell intrinsic Uchl5 deficiency promotes intratumoral CD8+ T cell infiltration.
A Representative flow plots showing CD8+ T cell populations from control and Uchl5-deficient MOC1-esc1 tumors are shown in B and C. B Quantitative estimate of various immune effector cells per milligram of tumor tissue in control and Uchl5-deficient MOC1-esc1 tumors, as determined by flow cytometry, n = 10 tumors per group. C Percentage of various immune effector cells in CD45+ cells in control and Uchl5-deficient MOC1-esc1 tumors, as determined by flow cytometry, n = 10 tumors per group. NK, natural killer cell. MDSC, myeloid-derived suppressive cell. D Ratio of Perforin+ CD8+ cytotoxic T lymphocytes (CTLs) to CD4+ Foxp3+ Treg cells in control and Uchl5-deficient MOC1-esc1 tumors, n = 10 tumors per group. Data in BD are representative of two independent experiments. E Tumor growth curves of C57BL/6 mice treated with anti-PD1 immunotherapy, challenged with control or Uchl5-deficient tumor cells, and with IgG or CD8+ T cell depleting antibodies treatment. n = 9 tumors for control group and 10 tumors for Uchl5 KO group. Timing of anti-PD1 and depleting antibody treatments were shown by orange and purple arrows. Data are representative of two independent experiments. F Schematic of the in vivo CD8+ T cell killing competition assay. Control and Uchl5-deficient tumor cells were engineered to express SIINFEKL peptide, mixed and injected into NSG mice subcutaneously. OT1 CD8+ T cells were injected via I.V. on day 7 after tumor inoculation, created in BioRender. G Calculated log2 fold changes in the ratio of tumor cells with sgRNAs targeting Uchl5 versus control sgRNA were normalized to the group injected with only PBS, n = 6 tumors per group, data are representative of three independent experiments. Data in B–D and G were calculated by unpaired, two-sided Student’s t-test and are represented as mean ± s.d., and data in (E) were analyzed by two-way ANOVA represented as mean ± s.e.m. Source data are provided as a Source Data file.
Fig. 4
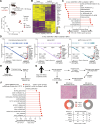
Fig. 4. Tumor cell intrinsic Uchl5 deficiency remodels extracellular matrix.
A Schematic of in vivo RNA-seq and Principal-component analysis (PCA) of replicate samples from RNA-seq analysis of control and Uchl5 KO MOC1-esc1 tumor cells purified from bulk tumor with or without PD1 treatment at day 15. Circles or triangles represent samples, n = 3 tumors for control groups and Uchl5 KO untreated group, 2 tumors for Uchl5 KO anti-PD1 treated, figure created in BioRender. B Heatmap illustrating hierarchical clustering and significantly differentially expressed genes in purified MOC1-esc1 cells from in vivo control and Uchl5-deficient tumors with or without anti-PD1 treatment. C Lollipop plot of gene set enrichment analysis showing the top 8 depleted and top 4 enriched gene sets in MOC1-esc1 cells isolated from Uchl5-deficient tumors relative to control tumors. D Mountain plots showing enrichment score for the Core Matrisome, hallmark EMT and partial-EMT gene sets in Uchl5-deficient cells relative to control cells isolated from in vivo tumors under anti-PD1 treatment. Extracellular matrix genes are called out. Data in B-D represent one experiment. E Schematic of single cell analysis from human HNSCC patients (n = 13 patients, 1711 cells). F Lollipop plot showing the top gene sets positively and negatively correlated with UCHL5 expression in malignant cells from scRNA-seq of human patient head and neck tumors. G Schematic of histology analysis of tumor samples from clinical trials (n = 51 patients). H Representative imaging of Hematoxylin and Eosin (H&E) staining of pretreatment tissue biopsies from patients enrolled in the clinical trials with or without Stromal Desmoplasia. Pie Chart Illustrating Post-Treatment Regression (PTR) Rates among patients with and without Stromal Desmoplasia. pTR-0: <10%; pTR-1: 10% − 50%; pTR-2: > 50%.
Fig. 5
Fig. 5. Uchl5-mediated control of Col17a1 expression contributes to immune evasion and ICB resistance in HNSCC.
A Expression of COL17A1 protein level across different cancer cell lines from the Cancer Cell Line Encyclopedia (CCLE) dataset, n = 4 − 69 samples per group. B Western blot and quantification of COL17A1 protein levels in control and Uchl5-deficient MOC1-esc1 cells, data is representative of two independent experiments. The samples derive from the same experiment, but COL17A1 and α-Tubulin were run on one gel, UCHL5 on another gel, both gels were processed in parallel under the same conditions. C, D Western blot and quantification of COL17A1 protein levels in control and Uchl5-deficient tumors harvest on day 16 after tumor inoculation, n = 7 tumors. The samples derive from the same experiment, COL17A1 and α-Tubulin were run on one gel. Data are representative of two independent experiments. E, FImmunohistochemistry (IHC) staining and quantification of COL17A1 in control or Uchl5-deficient tumors harvested on day 16 after tumor inoculation. n = 4 tumors for control group, 7 tumors for Uchl5-deficient tumors. G Tumor growth curves in mice challenged with control and Col17a1-deficient MOC1-esc1 tumor cells in NSG, WT C57BL/6 mice with or without anti-PD1 treatment. For the NSG group: n = 5 (Col17a1 sg1), n = 10 (Ctrl and Col17a1 sg2) tumors. For the WT group: n = 4 (Col17a1 sg1 untreated), n = 9 (Col17a1 sg1 PD1-treated); n = 10 (Ctrl untreated and Col17a1 sg2 untreated); n = 20 (Ctrl PD1-treated and Col17a1 sg2 PD1-treated) tumors. Data are representative of two independent experiments, and the comparisons are between Col17a1-deficient and control MOC1-esc1 tumor cells. H Western blot analysis of the expression of exogenously transduced COL17A1 in Uchl5-deficient MOC1-esc1 cells. The samples derive from the same experiment, COL17A1 and α-Tubulin were run on one gel, data is representative of two independent experiments. I Tumor growth and survival curves in WT C57BL/6 mice challenged with Uchl5-deficient MOC1-esc1 tumor cells with overexpression of either truncated human CD19 or mouse full-length COL17A1 with anti-PD1 treatment, n = 9 tumors for hCD19 group and 10 tumors for COL17A1 OE group, data are representative of two independent experiments. The samples derive from the same experiment, COL17A1 and α-Tubulin were run on one gel. Data in A was represented as mean ± s.d., Data in D and F were calculated by unpaired, two-sided Student’s t-test and are represented as mean ± s.d., data in (G) and (I) were analyzed by two-way ANOVA represented as mean ± s.e.m. Source data are provided as a Source Data file.

References

    1. Ferlay, J. et al. Estimating the global cancer incidence and mortality in 2018: GLOBOCAN sources and methods. Int. J. Cancer144, 1941–1953 (2019). - PubMed
    1. Johnson, D. E. et al. Head and neck squamous cell carcinoma. Nat. Rev. Dis. Prim.6, 92 (2020). - PMC - PubMed
    1. Cramer, J. D., Burtness, B. & Ferris, R. L. Immunotherapy for head and neck cancer: Recent advances and future directions. Oral. Oncol.99, 104460 (2019). - PMC - PubMed
    1. Zhang, X., Zeng, X., Li, Y. & Ju, D. Combinational Immunotherapy of Cancer: Novel Targets, Mechanisms, and Strategies. (Frontiers Media SA, 2024). - PMC - PubMed
    1. Villanueva, L., Álvarez-Errico, D. & Esteller, M. The contribution of epigenetics to cancer immunotherapy. Trends Immunol.41, 676–691 (2020). - PubMed

MeSH terms

Substances