. 2025 Sep 29;16(1):8546.
doi: 10.1038/s41467-025-63528-6.

TP53 variant clusters stratify phenotypic diversity in germline carriers and reveal an osteosarcoma-prone subgroup

Affiliations

TP53 variant clusters stratify phenotypic diversity in germline carriers and reveal an osteosarcoma-prone subgroup

Nicholas W Fischer et al. Nat Commun. .

Abstract

Li-Fraumeni syndrome (LFS) has recently been redefined as a 'spectrum' cancer predisposition disorder to reflect its broad phenotypic heterogeneity. This variability is thought to stem in part from the diverse functional impacts of TP53 variants, although the underlying mechanisms remain poorly understood and there is an unmet clinical need for effective risk stratification. Here, we apply unsupervised clustering to functional datasets and identify distinct TP53 variant groups with clinical relevance, including a monomeric subgroup enriched in osteosarcoma cases. In cellular validation assays, dermal fibroblasts from carriers of more functionally impaired variants exhibit increased metabolic growth rates, mirroring trends observed in cluster-stratified clinical outcomes. These findings demonstrate the feasibility of developing diagnostic assays to guide personalized cancer risk assessment. More broadly, our results show that nuances in TP53 dysfunction shape the germline TP53-related cancer susceptibility spectrum and provide a framework for functionally delineating variant carriers.


Conflict of interest statement

Competing interests: The authors declare no competing interests.

Figures

Fig. 1
Fig. 1. Overview of TP53 variant clustering and germline carrier stratification.
A discovery and validation set of confirmed/obligatory carriers were stratified based on the variant clusters. A retrospective clinical study identified distinct cancer patterns between strata, and biological relevance was confirmed through cellular functional assays.
Fig. 2
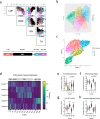
Fig. 2. Unsupervised cluster analysis of TP53 missense variants based on cellular TP53 functional features.
a Matrix correlation plots comparing scaled data (Z-score normalization) TP53 mutagenesis datasets covering the entire protein (LOF loss-of-function, DDR DNA damage repair, DN dominant negative activity, TA transcriptional activity),. Variants are colour-coded based on the functional domain they reside in: NTD N-terminal domain (red), DBD DNA-binding domain (black), OD oligomerization domain (cyan), CTD C-terminal domain (purple). Linear relationships between functional screens were assessed using Pearson’s correlation coefficient (r). b Principal component analysis (PCA) and unsupervised k-means clustering performed with TP53 mutagenesis cellular functional assay measurements. c Uniform manifold approximation and projection (UMAP) performed using TP53 mutagenesis cellular functional assay measurements and colour-coded based on PCA k-means clustering (N = 200, D = 0.4). d Heatmap displaying the codon frequencies and distributions of TP53 variant clusters. Red arrowheads indicate variant hotspots in cluster 5. PRR = proline-rich region. e–h Violin plots comparing the functional consequences of variants within each cluster. Sample sizes: cluster 1 (n = 791), cluster 2 (n = 419), cluster 3 (n = 381), cluster 4 (n = 448), cluster 5 (n = 269). P-values on plots were calculated using Kruskal-Wallis tests. Two-tailed Mann-Whitney U tests were used for pairwise comparisons (****p < 0.0001). Source data are provided as a Source Data file.
Fig. 3
Fig. 3. Alignment of TP53 clusters with the Variant Curation Expert Panel (VCEP) annotations and the representation of clusters across populations with and without cancer.
a Stacked bar plot showing VCEP annotated variants applied to the variant clusters (n = 106). Cluster 1 (42 classified of 791), cluster 2 (18 classified of 419), cluster 3 (21 classified of 381), cluster 4 (22 classified of 448), cluster 5 (3 classified of 269). b Bar graphs displaying the frequencies of germline variants in each cluster found in the NCI TP53 Database (n = 3113), (c) a multi-institutional validation cohort (n = 458), (d) gnomAD non-cancer dataset (n = 186), and (e) FLOSSIES database (n = 27). P-values on plots were calculated using chi-square tests. Source data are provided as a Source Data file.
Fig. 4
Fig. 4. Age at cancer diagnosis in germline TP53 variant carriers.
a Line plot displaying the cumulative cancer diagnosis ages over time and a box-and-whisker plot representing the ages at cancer diagnosis in the NCI TP53 Database (****p < 0.0001 compared to clusters 1 and 4, *p = 0.014 vs cluster 1, *p = 0.024 vs cluster 4); sample sizes: cluster 1 (n = 81), cluster 2 (n = 181), cluster 3 (n = 1126), cluster 4 (n = 46), cluster 5 (n = 40), FS/NS/DEL (n = 407). b Line plot displaying the cumulative cancer diagnosis ages over time and a box-and-whisker plot representing the ages at cancer diagnosis in the validation cohort (*p < 0.0001 compared to clusters 3 and FS/NS/DEL, *p = 0.014 compared to cluster 2, *p = 0.022 vs cluster 5, *p = 0.054 vs cluster 4); sample sizes: cluster 1 (n = 13), cluster 2 (n = 86), cluster 3 (n = 255), cluster 4 (n = 3), cluster 5 (n = 4), FS/NS/DEL (n = 125). c Line plot displaying the frequency of breast tumor diagnosis over time and a box-and-whisker plot representing the ages at cancer diagnosis (***p = 0.0003 vs cluster 1, ***p < 0.0001 vs cluster 2, ***p = 0.0002 vs cluster 4, **p = 0.0042 vs cluster 1, **p = 0.0064 vs cluster 2, **p = 0.0013 vs cluster 4, ****p < 0.0001 vs clusters 1, 2, and 4); sample sizes: cluster 1 (n = 15), cluster 2 (n = 69), cluster 3 (n = 307), cluster 4 (n = 15), cluster 5 (n = 13), FS/NS/DEL (n = 143). d Line plot displaying the frequency of ACC diagnosis over time and box-and-whisker plot representing the age at ACC onset (**p = 0.0045 vs cluster 2, **p = 0.0002 vs cluster 3, **p < 0.0001 vs FS/NS/DEL); sample sizes: cluster 1 (n = 2), cluster 2 (n = 18), cluster 3 (n = 73), cluster 4 (n = 4), cluster 5 (n = 2), FS/NS/DEL (n = 21). For all box-and-whisker plots, the center line represents the median, the box spans the interquartile range (25th to 75th percentiles), and the whiskers extend to the 10th and 90th percentiles. P-values on plots were calculated using Kruskal-Wallis tests. Two-tailed Mann-Whitney U tests were used for pairwise comparisons. Source data are provided as a Source Data file.
Fig. 5
Fig. 5. Cancer phenotypes in germline TP53 variant carriers classified based on the variant clusters.
a Stacked bar plot displaying the cancer type distribution patterns manifested in germline TP53 variant carriers. Cluster 1 (n = 105), cluster 2 (n = 219), cluster 3 (n = 1255), cluster 4 (n = 55), cluster 5 (n = 50), FS/NS/DEL (n = 467). b Bar graph showing the frequency of LFS-core cancer types (**FDR = 0.0035 vs cluster 2 and 3, **FDR = 0.0012 vs FS/NS/DEL). c Bar graph showing the frequency of colorectal cancers (*FDR = 0.0092 vs cluster 2, *FDR = 0.00015 vs cluster 3 and FS/NS/DEL). d Bar graph showing the frequency of patients experiencing multiple tumors (**FDR = 0.0031 cluster 3 vs cluster 1, **FDR = 0.0002 cluster 3 vs cluster 2, **FDR = 0.0031 cluster 3 vs cluster 4, **FDR = 0.0097 FS/NS/DEL vs cluster 1, **FDR = 0.0031 FS/NS/DEL vs cluster 2, **FDR = 0.0073 FS/NS/DEL vs cluster 4). e Bar graph showing frequency of carriers fulfilling classic LFS or Chompret criteria (****FDR < 0.0001 comparing to clusters 3, 5, and FS/NS/DEL). f Bar graph showing frequency of carriers fulfilling LFS-like criteria (LFL; Eeles and Birch criteria,) (**FDR = 0.0027 vs cluster 1, **FDR < 0.0001 vs cluster 2, **FDR = 0.0007 vs cluster 3, **FDR = 0.0005 vs cluster 5, **FDR < 0.0001 vs FS/NS/DEL). g Bar graph showing the frequency of osteosarcomas (**FDR = 0.0003 vs cluster 1, **FDR = 0.0002 vs cluster 2, **FDR = 0.0013 vs cluster 3, **FDR = 0.0003 vs cluster 4, **FDR = 0.004 vs FS/NS/DEL). P-values on plots were calculated using chi-square tests. Two-tailed Fisher’s exact tests were used for pairwise comparisons with FDR-corrected p-values. Source data are provided as a Source Data file.
Fig. 6
Fig. 6. Functional validation of TP53 variant clustering in cancer cells and non-cancer patient-derived cells.
a Bar graphs displaying clonogenic assay results in Saos-2 p53-null osteosarcoma cells and (b) in H1299 p53-null lung adenocarcinoma cells expressing TP53 variants representing each cluster (mean with SEM). c Bar graph showing clonogenic assay results in H1299 cells comparing R175 variants (mean with SEM). d Box-and-whisker plot of metabolic growth rates as measured by the MTT colorimetric assay using unstressed dermal fibroblasts from patient skin biopsies. e Box-and-whisker plot of TP53 variant scores as measured by mean TP53 target gene mRNA expression in patient blood-derived cells (fresh peripheral blood lymphocytes or lymphoblastoid cell lines). Wild-type (WT; n = 54), cluster 1 (n = 7), cluster 2 (n = 8), cluster 3 (n = 19), cluster 4 (n = 4), FS/NS/DEL (n = 8). Clonogenic and MTT assays were repeated at least twice and performed in triplicate and sextuplicate, respectively. For all box-and-whisker plots, the center line represents the median, the box spans the interquartile range (25th and 75th percentiles), and the whiskers extend to the minimum and maximum values. All pairwise statistical comparisons in the clonogenic assay are made relative to WT p53. P-values were calculated using one-tailed unpaired t-tests. Exact p-values for all pairwise comparisons are provided in Supplementary Data 3. Source data are provided as a Source Data file.
Fig. 7
Fig. 7. Interpretation of TP53 variant clusters as a cancer susceptibility continuum based on cellular functional and clinical evidence.
This schematic representation illustrates TP53 variant clusters positioned along a continuum of pathogenicity, ordered by increasing cancer risk. WT (teal) corresponds to normal p53 function and no elevated cancer risk. Cluster 1 (red) includes benign or conditionally pathogenic variants associated with lower risk. Cluster 4 (blue) comprises variants that retain WT-like function but are linked to attenuated phenotypes and intermediate risk. Cluster 2 (olive green) includes hypomorphic or partially functional variants that confer intermediate risk. Cluster 5 (magenta) encompasses monomeric variants with high risk as well as others with unclear mechanisms and uncertain risk. T (grey) represents truncating variants associated with high risk due to loss of p53 activity. Cluster 3 (green) consists of DN variants that interfere with WT function and confer high risk.

References

    1. Li, F. P. & Fraumeni, J. F. Jr. Rhabdomyosarcoma in children: epidemiologic study and identification of a familial cancer syndrome. J. Natl Cancer Inst.43, 1365–1373 (1969). - PubMed
    1. Malkin, D. et al. Germ line p53 mutations in a familial syndrome of breast cancer, sarcomas, and other neoplasms. Science250, 1233–1238 (1990). - PubMed
    1. Srivastava, S. et al. Germ-line transmission of a mutated p53 gene in a cancer-prone family with Li-Fraumeni syndrome. Nature348, 747–749 (1990). - PubMed
    1. Birch, J. M. et al. Prevalence and diversity of constitutional mutations in the p53 gene among 21 Li-Fraumeni families. Cancer Res54, 1298–1304 (1994). - PubMed
    1. Eeles, R. A. Germline mutations in the TP53 gene. Cancer Surv.25, 101–124 (1995). - PubMed

Substances