. 2025 Sep 29;16(1):8284.
doi: 10.1038/s41467-025-63622-9.

A basic framework to explain splice-site choice in eukaryotes

Affiliations

A basic framework to explain splice-site choice in eukaryotes

Craig I Dent et al. Nat Commun. .

Abstract

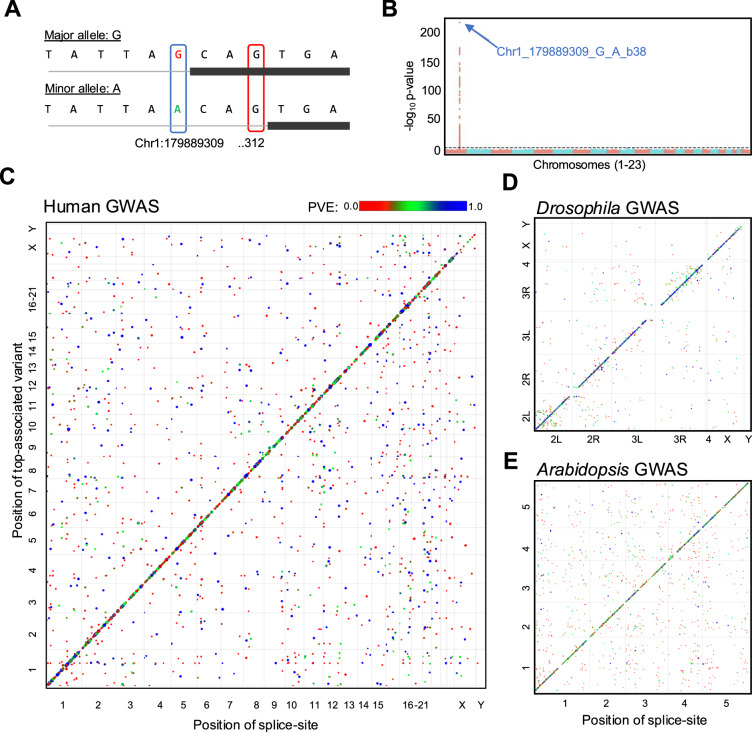
Changes in splicing can mediate phenotypic variation, ranging from flowering time differences in plants to genetic diseases in humans. Splicing changes occur due to differences in splice-site strength, often influenced by genetic variation and the environment. How genetic variation influences splice-site strength remains poorly understood, largely because splice-site usage across transcriptomes has not been empirically quantified. Here, we quantify the use of individual splice-sites in Arabidopsis, Drosophila and humans and treat these measurements as molecular phenotypes to map variation in splice-site usage through GWAS. We carry out more than 130,000 GWAS with splice-site usage phenotypes, cataloguing genetic variation associated with changes in the usage of individual splice-sites across transcriptomes. We find that most of the common, genetically controlled variation in splicing is cis and there are no major trans hotspots in the three species analyzed. We group splice-sites based on GT[N]4 or [N]4AG sequence, quantify their average use, develop a ranking and show that these hexamer rankings provide a simple and comparable feature across species to explain most of the splice-site choice. Transcriptome analyses in several species suggest that hexamer rankings offer a rule that helps explain splice-site choices, forming a basis for a shared splicing logic in eukaryotes.


Conflict of interest statement

Competing interests: The authors declare no competing interests.

Figures

Fig. 1
Fig. 1. Splice-site usage varies extensively between individuals.
Distribution of splice-sites that show differences in their usage between individuals in humans (A), Drosophila (B) and Arabidopsis (C). The sites are grouped based on the maximum difference in their usage between individuals. The yellow region highlights the sites that display more than 20% difference (0.2 difference in) between extreme samples. Blue dots represent the average variance in splice-site usage between all individuals for each of the bins.
Fig. 2
Fig. 2. Splicing variability can be mapped accurately, and it is mostly cis-regulated.
A A schematic of the sequences surrounding two competing splice-sites in TOR1AIP1 is shown. B Manhattan plot of the splice-site mutation at chr1:179,889,309. SpliSER-GWAS analysis identifies causal SNP for variation in the usage of splice-sites at the TOR1AIP1 locus in humans. The splice-site mutation at chr1:179,889,309 (309) allows the usage of chr1:179,889,312 (312) as a splice-site, and variation in the usage of both sites map to the 309 polymorphism. Scatter plot of splice-site positions and their highest associated SNPs in the human heart (C), Drosophila (D) and Arabidopsis (E) across corresponding genomes. Colour scale represent the proportion of variance explained (PVE) by the associated top SNP. The sizes of the dots are also correlated with PVE.
Fig. 3
Fig. 3. Genetic variation affecting splice-site choice is often near the splice-site and high resolution SpliSER-GWAS allows inferring the best nucleotides that promote splicing.
Distribution of the distances of the highest associated SNPs (lowest p-value) detected in SpliSER-GWAS for donors (A) and acceptors (B) in Arabidopsis, Drosophila and Humans. Intronic regions are shaded for clarity. The distribution of splice-promoting allelic variation for positions −2 to +6 around the splice-donor site and −6 to +2 around the splice-acceptor site based on associations from all three species, considering GWAS where the Top SNP and the closest SNP are the same. Most frequent splice-promoting nucleotides are highlighted.
Fig. 4
Fig. 4. Experimental perturbations of hexamer sequences alter splice-site choice.
A Direct comparison of competing hexamers in minigene constructs of Rosenberg et al.. Blue line represents permuted thresholds calculated from 10,000 permutations and the actual experimental data (red) with varying combinations of hexamers. The number of unique competing pairs tested is shown above the percentages. Conversion of a good intron into a bad intron (B) or bad intron into a good intron (C) through change of hexamers. mCHERRY fluorescence is shown along with the RT-PCR amplification. The experiments were repeated twice in two independent experiments, which yielded similar results.

References

    1. Rogalska, M. E., Vivori, C. & Valcarcel, J. Regulation of pre-mRNA splicing: roles in physiology and disease, and therapeutic prospects. Nat. Rev. Genet.24, 251–269 (2023). - PubMed
    1. Marasco, L. E. & Kornblihtt, A. R. The physiology of alternative splicing. Nat. Rev. Mol. Cell Biol.24, 242–254 (2023). - PubMed
    1. Nasif, S., Contu, L. & Muhlemann, O. Beyond quality control: The role of nonsense-mediated mRNA decay (NMD) in regulating gene expression. Semin. Cell Dev. Biol.75, 78–87 (2018). - PubMed
    1. Black, D. L. Mechanisms of alternative pre-messenger RNA splicing. Annu. Rev. Biochem.72, 291–336 (2003). - PubMed
    1. Liu, Q., Fang, L. & Wu, C. Alternative splicing and isoforms: from mechanisms to diseases. Genes13, 401 (2022). - PMC - PubMed

Substances

LinkOut - more resources