. 2025 Sep 29;16(1):8566.
doi: 10.1038/s41467-025-63599-5.

The pericardium forms as a distinct structure during heart formation

Affiliations

The pericardium forms as a distinct structure during heart formation

Hannah R Moran et al. Nat Commun. .

Abstract

The heart is formed from diverse cell lineages that assemble into a functional unit, including the pericardium, a mesothelial sac that supports movement, homeostasis, and immune responses. However, its developmental origins remain unresolved. Here, we find the pericardium forms within the lateral plate mesoderm from dedicated mesothelial progenitors that are distinct from the classic heart field. Imaging of transgenic zebrafish reporters documents lateral plate mesoderm cells that emerge lateral of the heart field among a continuous mesothelial progenitor band. Single-cell transcriptomics and trajectories of hand2-expressing lateral plate mesoderm reveal distinct populations of mesothelial precursors, including pericardial precursors. Their mesothelial gene expression signature is conserved in mammals and carries over to post-natal development. Light sheet imaging and machine learning-supported cell tracking documents the migration of pericardial precursors from the edge of the heart field to form the pericardial cavity. Genetic perturbations reveal this process occurs independently of heart formation, with canonical Wnt/β-catenin signaling modulating pericardial cell number and tissue rigidity. We connect the pathological expression of secreted Wnt antagonists of the SFRP family found in pediatric dilated cardiomyopathy to increased pericardial stiffness in neonatal rats. Altogether, our data integrate pericardium formation as an independent process into heart morphogenesis.


Conflict of interest statement

Competing interests: The authors declare no competing interests.

Figures

Fig. 1
Fig. 1. The pericardium forms continuous with the mesothelium-forming LPM.
AD Anatomy of the heart and pericardium in zebrafish embryos and early larvae. A, B Lateral confocal imaging of transgenic hand2:EGFP;myl7:DsRed zebrafish, anterior to the left. Embryo showing hand2:EGFP and myl7:DsRed (myocardium marker) co-expression in the heart tube and hand2:EGFP-expressing cell populations in the pericardium, posterior mesothelium, pectoral fin, and pharyngeal arches at 48 hpf (A 10x; B 20x). C, D Ventral confocal imaging (C 72 hpf single Z-slice, D 96 hpf max projection, anterior to the top) of hand2:EGFP;myl7:DsRed embryo showing reporter co-expression in the atrium and ventricle myocardium and hand2:EGFP-expressing cells in the pharyngeal arches and pericardial sac surrounding the heart (C), with the pericardium acquiring a mesh-like squamous epithelial structure at 96 hpf (D). E SPIM-based Mercator projection of double-transgenic hand2:EGFP;drl:mCherry embryo at 14 hpf, anterior to the top, showing the anterior-to-posterior extent of lateral-most hand2:EGFP-expressing LPM cells fated as mesothelial progenitors (mp), with the anterior-most extent of the bilateral stripes indicated by white arrowheads. Dotted box outlines region of interest for subsequent imaging panels. FH Dorsal confocal imaging of transgenic reporter combinations at the level of the heart field, anterior to the top, asterisks showing the midline where the heart field converges, arrowheads at lateral mesh-like cells. F hand2:EGFP;drl:mCherry embryo at 16 hpf prior to medial heart field migration, showing hand2:EGFP-expressing cell populations comprising lateral-most LPM. G hand2:EGFP;nkx2.5:ZsYellow embryo with dual-marked emerging cardiac disk. H hand2:EGFP;tbx1:mCerulean embryo with similar co-expression across bilateral mesh-like cells and the cardiac disk. N = 3 independent experiments with 5–7 embryos per experiment. I SPIM-based live imaging stills from Movie 1 depicting a hand2:EGFP;tbx1:mCerulean embryo from 19 to 24 hpf, anterior to the top, showing hand2:EGFP-expressing lateral-most cells migrating away from the midline towards the front (migration front, yellow dashed line), while cardiac precursors form the heart tube towards the midline (white dashed line). White arrows for migration direction. N = 1 representative embryo imaged with SPIM. pa pharyngeal arches, pc pericardium, ht heart, v ventricle, a atrium, hg hatching gland. Scale bars AD 100 μm, EH 200 μm, I 50 μm.
Fig. 2
Fig. 2. Pericardial progenitors have distinct migratory trajectories among heart-contributing lineages.
A Representative lateral (24 hpf, anterior to the left) and dorsal (18 hpf, anterior to the bottom) view of hand2:EGFP zebrafish embryos depicting embryo orientation and direction of pericardial migration as oriented in subsequent stills. N = 3 independent experiments with three embryos imaged per experiment. Arrowhead depicts the angle of 3D reconstruction in BF. BE Still frames of SPIM-based timelapse movie showing hand2:EGFP cell trajectories as determined by machine learning-based backtracking, anterior to the bottom. The representative stills cover development from 20–30 hpf (B), 30–40 hpf (C), 40–50 hpf (D), and 50–60 hpf (E). Arrowheads in (E) show jitter from heartbeat. F Snapshot of timelapse movie (Movies 2, 3, anterior to the bottom) showing summarized hand2:EGFP cell trajectories of the developing myocardium (left) and pericardium (right) from 20 to 60 hpf. GJ Quantification of tracked cells across replicates for myocardial and pericardial trajectories (G). Track displacement from the position start over the time series in the myocardium and pericardium (p = 0.0241). H Quantification of the speed of individual cell tracks over time (p = 0.0320). I Quantification of distance between cells (nearest neighbor) at 60 hpf (p = <0.0001). J Quantification of the number of branch points, where a single track branches into a new track indicating a cell division, in the myocardium and pericardium (p = 0.0013). GJ analyzed using Mann–Whitney t-test, N = 2 independent in toto tracking series of a single embryo from different clutches each. Each dot represents a single tracked cell analyzed per tracking experiment. Source data are provided as a Source Data file. Scale bar A 100 μm and BF 70 μm.
Fig. 3
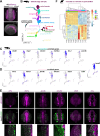
Fig. 3. Pericardial and myocardial precursors are transcriptionally distinct populations.
A Representative confocal max projection of drl:mCherry;hand2:EGFP double-transgenic embryo at 10 hpf as used for FACS-based isolation of post-gastrulation LPM for 10xGenomics-based single-cell transcriptomics; anterior-posterior axis as indicated. N = 3 independent experiments with three embryos imaged per experiment. B UMAP plot of single-cell transcriptomes of mCherry-sorted 10 hpf drl:mCherry;hand2:EGFP zebrafish embryo cells showing 18 significant cell clusters, colored by identified subpopulation. C, D UMAP plots of key myocardial (C) and pericardial genes (D) expressed across identified cluster identities. Cell representations are colored by scaled expression values using lower and upper 2%-quantiles as boundaries. E Whole-mount hybridization chain reaction (HCR) of representative pericardial/mesothelial genes wt1a, fzd7a, jam2b, twist1a, sfrp5, and fn1a. N = 3 independent experiments with 8–10 embryos per experiment. F Clustering analysis of bulk mRNA-sequenced left ventricle myocardium (Myo) and pericardium (Per) from neonatal rats for genes defining myocardium versus pericardium as identified from the zebrafish-based scRNA-seq analysis in (B). Heatmap bins colored by row-scaled log2-normalized counts; columns (samples) split by tissue type; rows and columns ordered by hierarchical clustering (scaled expression values), sex of sample indicated on top. Scale bar A, B, E 200 μm. Species silhouettes were adapted from the PhyloPic database (https://www.phylopic.org/).
Fig. 4
Fig. 4. The pericardial lineage trajectory becomes distinct prior to heart tube formation.
A Dotplot including key cell fate marker genes to annotate broad mesothelial, pericardial, and myocardial clusters, respectively. Dots colored by column-scaled mean expression (log-transformed library-size-normalized counts) and sized by expression frequency (fraction of cells with non-zero counts). B Dorsal confocal imaging of representative dual-transgenic hand2:EGFP;nkx2.5:ZsYellow zebrafish embryo at 16 hpf showing marker co-expression and heterogeneity in prospective cardiac and pericardial progenitor cells around the heart field; anterior to the top. N = 3 independent experiments with 5–7 embryos per experiment. CE Slingshot-based trajectory inference analysis of early LPM cells assigned using key marker genes to the public Zebrahub dataset of single-cell transcriptomes throughout zebrafish development. Inferred end points for myocardium and pericardium indicated as color-coded clusters (C). PCA plots of key myocardial (D) and pericardial genes (E) expressed across identities over time. Cells are colored by scaled expression values using lower and upper 2%-quantiles as boundaries. Scale bar B 200 μm.
Fig. 5
Fig. 5. The pericardium forms despite developmental insults to heart formation.
AH Confocal imaging of hand2:EGFP transgenic zebrafish (green), live (A, C, E, G 24 hpf dorsal views, anterior to top) or with immunofluorescence using anti-MHC antibody (MF20, magenta) to show myocardium (B, D, F, H 60 hpf ventral views, anterior to top). A Representative confocal image of 24 hpf hand2:EGFP transgenic embryo showing hand2:EGFP-expressing wild-type pericardial precursors and heart tube development (white arrowhead, dashed outline) as dorsal view. B Wild-type reference for hand2:EGFP-expressing embryos and MHC counterstained at 60 hpf. C, D Delayed and disrupted heart tube formation upon mef2ca/b knockdown still allows for pericardium formation. Representative confocal image of 24 hpf hand2:EGFP embryo injected with both mef2ca and mef2cb morpholinos (C), showing hand2:EGFP-expressing pericardial precursors and severely delayed or absent medial migration of heart tube progenitors (open arrowhead) and at 60 hpf with rudimentary heart tube (D, white arrowhead). E, F Loss of endoderm and cardia bifida still allows for pericardium formation. Representative confocal image of 24 hpf sox32ta56-homozygous mutant zebrafish in the hand2:EGFP background with pericardial precursors present and absent midline migration of heart tube progenitors (E); cardia bifida (casanova phenotype) and two pericardial cavities formed at 60 hpf (F). G, H Representative confocal image of 24 hpf hans6 mutant zebrafish in the hand2:EGFP background showing disrupted pericardial and cardiac precursor migration (open arrowhead) (G) and absent cardiac chambers (asterisk) and a pericardial cavity at 60 hpf (H). N = 3 independent experiments with 5–7 embryos per experiment. v ventricle, a atrium, pa pharyngeal arches. Scale bar AH 200 μm.
Fig. 6
Fig. 6. Wnt/β-catenin signaling is differentially active across pericardial progenitors.
A, B Metascape analysis of top-50 cluster-defining genes from early LPM scRNA-seq; gene ontology terms enriched in myocardial cluster (A), and pericardial cluster (B); note regulation of canonical Wnt signaling as significant in pericardial cells. CE Confocal max projections of representative transgene expression for hand2:EGFP (green) and 7xTCF:mCherry (magenta, broadly reading out canonical Wnt signaling activity) with colocalization (white overlay), embryonic axis as indicated. At 10 hpf, canonical Wnt signaling shows a graded activity from the posterior towards the anterior (C lateral view, asterisk). At the start of heart field convergence, various anterior LPM cells show heterogeneous canonical Wnt activity, with lateral-most putative pericardial progenitors strongly expressing the 7xTCF:mCherry reporter amongst the broader TCF-expressing cells (D dorsal view, arrowheads). This pattern continues throughout to 24 hpf (E lateral view, white arrowheads). F, G Expression of canonical Wnt signaling-associated genes across myocardial and pericardial/mesothelial cells at tailbud stage in zebrafish. Cropped UMAP plot to depict cell clusters of interest (F) and individual Wnt signaling-associated genes, with expressing cells colored by scaled expression values using lower and upper 2%-quantiles as boundaries. Source data are provided as a Source Data file. (G). Scale bar CE 200 μm.
Fig. 7
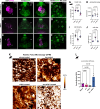
Fig. 7. Inhibition of Wnt/β-catenin alters pericardial morphology and stiffness.
AE Ventral confocal imaging (max projection) of representative 72 hpf hand2:EGFP;myl7DsRed larvae undergoing distinct treatments as indicated; anterior to the top; v ventricle, a atrium. A, B Representative larvae treated with DMSO vehicle only as control at 18 hpf overnight showing hand2:EGFP-expressing pericardial sac surrounding the heart at 72 hpf (A, 20x) and cellular density (B, 40x zoom, representative nuclei marked with dashed lines). C, D Ventral images of representative hand2:EGFP;myl7:DsRed larvae treated with the Wnt signaling inhibitor IWR-1 at 18 hpf overnight, showing expanded pericardial sac and edema with large, stretched cells surrounding the larval zebrafish heart at 72 hpf (C 20x) and lower cellular density (D 40x). E, F Ventral images of hand2:EGFP;myl7:DsRed larvae treated with BDM as myosin II inhibitor at 18 hpf overnight showing expanded pericardial sac with normal cell distribution at 72 hpf (E 20x) and cellular density (F 40x). GJ Quantifications of pericardial and cardiac features following the treatments. One-way ANOVA, n = 6 animals, three independent experiments. G Heart rate of vehicle-treated, Wnt-inhibited, and myosin II-inhibited (BDM) animals (p = 0.6056 DMSO to IWR-1, p = 0.0001 DMSO to BDM). H Pericardial area (distribution per ventral view), showing increased pericardial area in IWR-1-treated animals (p = 0.0631 DMSO to IWR-1, p = 0.317- DMSO to BDM). I Cell density (cells per square millimeter), showing decreased cell density in IWR-1-treated animals only (p = 0.0001 DMSO to IWR-1, p = 0.01345 DMSO to BDM). J Cell size showing increases in IWR-1-treated embryos only (p = 0.0001 DMSO to IWR-1, p = 0.9918 DMSO to BDM). K, L Increased tissue stiffness in the pericardium of rats treated with PBS (vehicle), Iso only, sFRP1 only, or combined Isoproterenol (Iso) and SFRP1 (n = 3 per condition). Neonatal rats (0-to-4-day old rats) were injected intraperitoneally with 0.05 mg/kg/day of human recombinant sFRP1 protein and Iso in an animal model of pediatric dilated cardiomyopathy. Atomic force microscopy (AFM) of dissected pericardia provided measures for Young’s modulus (kPa) as readout for tissue elasticity, with treated pericardia showing increased stiffness with combined Iso and sFRP1 only (K) as quantified per sample(L, unpaired two-tailed t-test, p = 0.9093 vehicle to Iso only, p = 0.6129 vehicle to sFRP1 only, p = 0.0140 vehicle to Iso + sFRP1). Each dot represents an individual sample. Representative images of control and = treated rats. Source data are provided as a Source Data file. Scale bar A, C, E 200 μm; B, D, F (40x) 50 μm. Species silhouettes were adapted from the PhyloPic database (https://www.phylopic.org/).

Update of

References

    1. Jaworska-Wilczynska, M., Trzaskoma, P., Szczepankiewicz, A. A. & Hryniewiecki, T. Pericardium: structure and function in health and disease. Folia Histochem. Cytobiol.54, 121–125 (2016). - PubMed
    1. Schulte, I., Schlueter, J., Abu-Issa, R., Brand, T. & Männer, J. Morphological and molecular left-right asymmetries in the development of the proepicardium: a comparative analysis on mouse and chick embryos. Dev. Dyn.236, 684–695 (2007). - PubMed
    1. Ratajska, A., Czarnowska, E. & Ciszek, B. Embryonic development of the proepicardium and coronary vessels. Int. J. Dev. Biol.52, 229–236 (2008). - PubMed
    1. Kruithof, B. P. T. et al. BMP and FGF regulate the differentiation of multipotential pericardial mesoderm into the myocardial or epicardial lineage. Dev. Biol.295, 507–522 (2006). - PubMed
    1. Shabetai, R. Function of the normal pericardium. Clin. Cardiol.22, I4–I5 (1999). - PMC - PubMed

Substances

LinkOut - more resources