. 2025 Sep 29;10(1):64.
doi: 10.1038/s41525-025-00523-2.

Biallelic variants in BBOX1 cause L-Carnitine deficiency and elevated γ-butyrobetaine

Affiliations

Biallelic variants in BBOX1 cause L-Carnitine deficiency and elevated γ-butyrobetaine

Xiao Li et al. NPJ Genom Med. .

Abstract

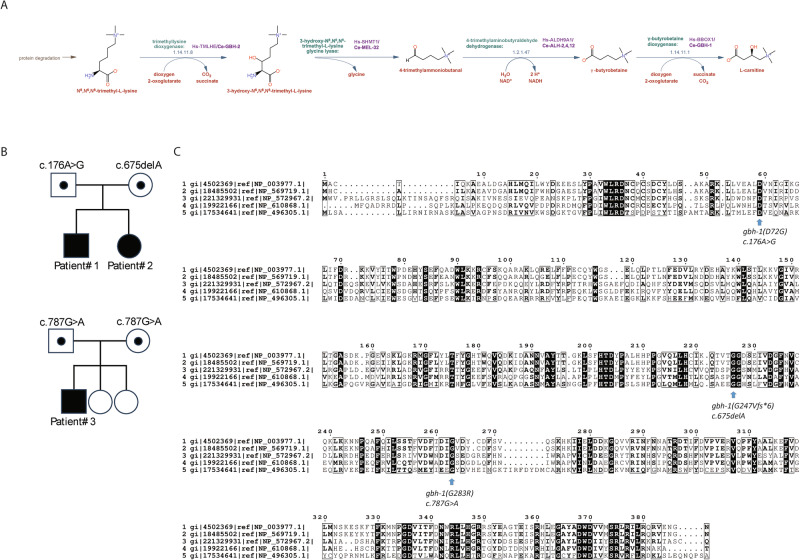
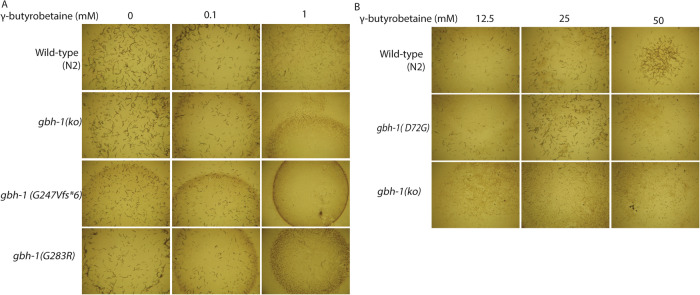
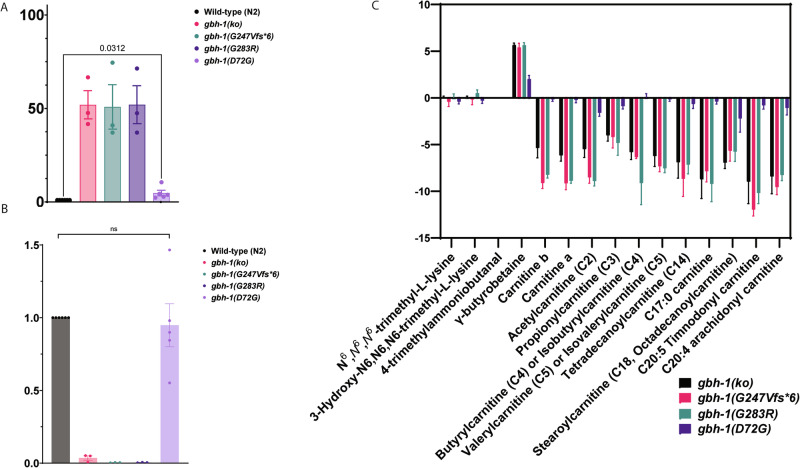
Gamma-butyrobetaine hydroxylase (BBOX1) catalyses the last step of carnitine biosynthesis, converting γ-butyrobetaine (γ-BB) into L-carnitine. Here we show, for the first time, that biallelic variants in BBOX1 are associated with decreased levels of L-carnitine and increased plasma levels of γ-BB in three patients from two unrelated families presenting with myopathic, neurodevelopmental, and late-onset psychiatric manifestations. Using a knockout C. elegans model of BBOX1 homolog, gbh-1, and strains harboring patient-derived variants (gbh-1(D72G) for p.Asp59Gly, gbh-1(G283R) for p.Gly263Arg, and gbh-1(G247Vfs6) for p.Gly227Valfs*6), we show very low L-carnitine levels and significantly elevated γ-BB in c.675delA and c.787G>A mutants, and moderately elevated γ-BB in c.176A>G. Furthermore, we observed a lethal embryonic phenotype for the gbh-1 loss-of-function strains, which was rescued upon L-carnitine supplementation. Our study provides novel insights into the clinical and biochemical consequences of BBOX1-related L-carnitine biosynthesis deficiency and establishes C. elegans as a model to study the effects of BBOX1 deficiency.


Conflict of interest statement

Competing interests: The authors declare no competing interests.

Figures

Fig. 1
Fig. 1. Biochemical pathway and cross-species conservation of BBOX1/GBH-1.
A L-Carnitine Biosynthesis Pathway: Four steps of the L-carnitine biosynthesis pathway, catalyzed by respective conserved orthologous enzymes in humans (Hs) and C. elegans (Ce), ended by the production of L-carnitine by BBOX1/GBH-1; Pathway was generated and adapted from MetaCyc database (https://metacyc.org/pathway?orgid=META&id=PWY-6100&ENZORG=TAX-9606&detail-level=3). B Patient pedigrees; C BBOX1/GBH-1 sequence conservation and variant modeling. The sequence alignment suggests the conservation of the BBOX1 across various species, including humans, mice, zebrafish, fruit flies, and C. elegans (GBH-1) (from top to bottom). The positions of amino acid residues altered in patient-derived variants are invariant. CRISPR/Cas9-assisted gene editing in C. elegans models the human variants p.Asp59Gly, p.Gly263Arg, and p.Gly227Valfs*6, corresponding to D59G, G283R, and G247Vfs*6 in GBH-1, to examine their impact on the function of the L-carnitine biosynthesis pathway.
Fig. 2
Fig. 2. L-carnitine rescues nutritional deficits in C. elegans gbh-1 mutants.
A Hatch rate analysis on thin versus thick E. coli OP50 lawns shows semi-lethality in gbh-1(ko), G247Vfs*6, and G283R mutants, but not D72G, under standard conditions. Enhanced survival on thick OP50 lawns suggests semi-lethality is mitigated by improved nutritional availability; B Starvation–refeeding experiments conducted on thin OP50 plates reveal consistent F1 embryonic lethality in gbh-1(ko), G247Vfs*6, and G283R strains. When refeeding occurs with the HB101 E. coli strain, known for dense lawn formation, lethality is rescued. Supplementing OP50 with 1mM L-carnitine also recues lethality of these strains on OP50; C In a similar starvation–refeeding experiments to (B), F1 embryonic lethality of gbh-1(ko), G247Vfs*6, and G283R strains is rescued by supplementation with 100 µM L-carnitine, or the use of the BW25113 bacterial strain, which also forms a dense lawn; D Starvation–refeeding experiments conducted on a BW25113(ΔcaiA) plates resulted in the F1 embryonic lethality phenotype for gbh-1(ko), G247Vfs*6, and G283R strains; E Without prior starvation, gbh-1(ko), G247Vfs*6, and G283R worms demonstrate consistent F1 embryonic lethality on BW25113(ΔcaiA) plates. The lethality is consistent across gbh-1 mutants except for D72G. A and CE Statistical significance: ***p < 0.001 and ****p < 0.0001 (unpaired t-test). Bar graphs represent hatch rates under various conditions. Error bars represent the standard error of the mean.
Fig. 3
Fig. 3. Sensitivity of gbh-1 mutant C. elegans strains to γ-butyrobetaine exposure.
A Wild-type N2, gbh-1(ko), gbh-1(G247Vfs6), and gbh-1(G283R) worms subjected to different concentrations of γ-butyrobetaine. A complete F1 embryonic lethality for gbh-1(ko), gbh-1(G247Vfs6), and gbh-1(G283R) worms at a 1 mM concentration of γ-butyrobetaine; B gbh-1(D72G) worms show robustness against γ-butyrobetaine, with survival unaffected even at elevated concentrations up to 50 mM, similar to N2 worms.
Fig. 4
Fig. 4. Metabolic alterations in gbh-1 mutant strains revealed by HPLC-MS.
A A substantial accumulation of γ-butyrobetaine in gbh-1(ko), gbh-1(G247Vfs*6), and gbh-1(G283R) mutants, exhibiting over a 50-fold increase compared to wild-type N2 worms. A modest increase of approximately 2-fold and statistically significant (non-paired t-test) is observed in gbh-1(D72G) mutants. The y-axis represents fold changes; B L-carnitine is undetectable in gbh-1(ko), gbh-1(G247Vfs*6), and gbh-1(G283R) strains, indicating a disruption in its biosynthesis. In contrast, gbh-1(D72G) worms maintain comparable L-carnitine levels to N2 worms. The y-axis represents fold changes; C The acylcarnitine spectrum is markedly absent in gbh-1(ko), gbh-1(G247Vfs*6), and gbh-1(G283R) worms, as reflected by non-detectable levels across these mutants. Metabolites upstream of γ-butyrobetaine do not display significant changes. The y-axis represents the log2 fold change. A & B Statistical significance: p = 0.0312 and p > 0.05 (ns) (unpaired t-test). Bar graphs represent the normalized ratio against metabolite quantification of wild-type samples in each dataset. Error bars represent the standard error of the mean.

References

    1. Longo, N., Frigeni, M. & Pasquali, M. Carnitine transport and fatty acid oxidation. Biochim. Biophys. Acta1863, 2422–2435 (2016). - PMC - PubMed
    1. Nezu, J. et al. Primary systemic carnitine deficiency is caused by mutations in a gene encoding sodium ion-dependent carnitine transporter. Nat. Genet.21, 91–94 (1999). - PubMed
    1. Vaz, F. M. & Wanders, R. J. A. Carnitine biosynthesis in mammals. Biochem. J.361, 417–429 (2002). - PMC - PubMed
    1. Rebouche, C. J. & Engel, A. G. Tissue distribution of carnitine biosynthetic enzymes in man. Biochim. Biophys. Acta630, 22–29 (1980). - PubMed
    1. Almannai, M., Alfadhel, M. & El-Hattab, A. W. Carnitine Inborn Errors of Metabolism. Molecules24, 3251 (2019). - PMC - PubMed

LinkOut - more resources