. 2025 Sep 29;16(1):8576.
doi: 10.1038/s41467-025-63612-x.

Contractile fibroblasts form a transient niche for the branching mammary epithelium

Affiliations

Contractile fibroblasts form a transient niche for the branching mammary epithelium

Jakub Sumbal et al. Nat Commun. .

Abstract

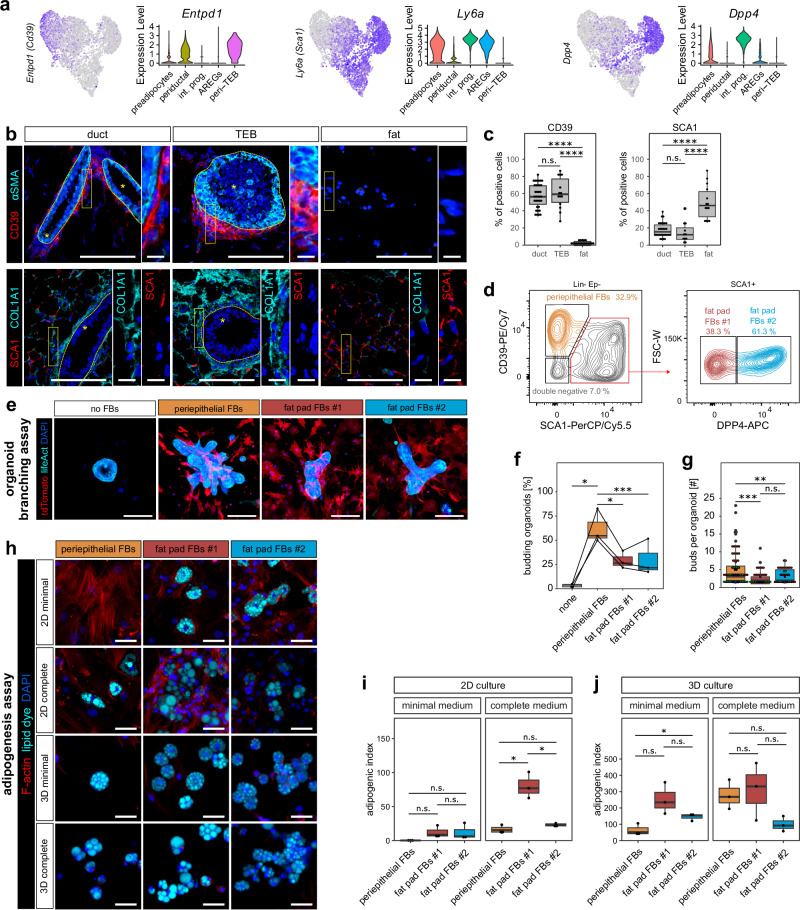
Fibroblasts are stromal cells found in connective tissue that are critical for organ development, tissue homeostasis and pathology. Single-cell transcriptomic analyses have revealed a high level of inter- and intra-organ heterogeneity of fibroblasts. However, the functional implications and lineage relations of different fibroblast subtypes remained unexplored, especially in the mammary gland. Here, we provide a comprehensive characterization of pubertal mouse mammary fibroblasts, through single-cell RNA sequencing, spatial mapping, functional assays, and in vivo lineage tracing. We unravel a transient niche-forming population of specialized contractile fibroblasts that exclusively localize around the tips of the growing mammary epithelium and are recruited from preadipocytes in the surrounding fat pad stroma. Using organoid-fibroblast co-cultures we reveal that different fibroblast populations can acquire contractile features when in direct contact with the epithelium, promoting organoid branching. The detailed in vivo characterization of these specialized cells and their lineage history provides insights into fibroblast heterogeneity and implicates their importance for creating a signalling niche during mouse mammary gland development.


Conflict of interest statement

Competing interests: The authors declare no conflict of interest.

Figures

Fig. 1
Fig. 1. Single cell RNA sequencing of pubertal mammary fibroblasts.
a A representative image of a pubertal mammary gland from a 5-week-old female mouse. Scale bar: 1 cm. b Histological sections of an epithelial ducts, a terminal end bud (TEB) and a fat pad region. Scale bar: 100 µm. The asterisks mark the lumen of the epithelial compartment. c Lineage-tracing of fibroblasts in a 5-week-old Col1a2-CreERT;R26-mTmG female, 24 h after tamoxifen administration. Fibroblasts are detected as GFP+ cells around ducts, TEBs and in the fat pad. Scale bar: 100 µm. d Immunostaining for αSMA (in white) in a cleared whole-mount mammary gland detects fibroblasts around a TEB (the TEB borders are delineated by a red line) as well as cap cells of the TEBs. The top and middle optical sections of the imaged z-stack are presented; their localization according to the TEB is indicated by a green line. The full z-stack is presented in Supplementary Movie 1. Scale bars: 100 µm, 50 µm in detail (magnifications of the boxed areas). The asterisk marks the epithelium. a–d The images are representative of at least 3 biological replicates. e UMAP representation of sequenced mammary fibroblasts showing the different fibroblast clusters. f Transcriptomic scores of fibroblasts from developing fat pads plotted over our dataset of mammary fibroblasts. g Annotation of fibroblast clusters. h UMAPs showing expression of cluster marker genes. i, j Dot plots showing the expression of contractility-related genes (i) and genes encoding ECM components (j) within the different cell clusters identified.
Fig. 2
Fig. 2. Spatial atlas of mammary fibroblasts during pubertal morphogenesis.
a A dot plot showing expression of marker genes used for spatial mapping. b A representative overview of mammary gland on a histological section: red squares show fields of view (FOV) containing ducts, TEBs or distal fat pad. Scale bar: 100 µm. Representative of >5 biological replicates. c Representative images showing the expression of various RNA or protein markers in regions containing ducts, TEBs or distal fat pad, the insets show details on fibroblasts. * marks the epithelial compartment encircled by a yellow dashed line. Scale bar: 100 µm, 10 µm in detail. d Quantification of marker-positive stromal cells in different regions of the mammary gland, shown as box plots. Each dot represents a single FOV, n = 3 biological replicates, N = 59 FOVs for αSMA, 57 FOVs for SDC1, 113 FOVs for Mfap4, 90 FOVs for Pi16, 74 FOVs for F3, 81 FOVs for Enpep. Statistical analysis: Wilcoxon test, two-sided.
Fig. 3
Fig. 3. Distinct fibroblast populations show differences in morphogenetic and adipogenic capacity.
a UMAP representations and violin plots showing the expression of Entpd1 (CD39 gene), Ly6a (SCA1 gene) and Dpp4 in mammary fibroblasts. b Representative images showing the expression of CD39 and SCA1, alongside αSMA and COL1A1, in mammary gland regions containing ducts, TEBs or distal fat pad. The insets show details on fibroblasts. The dashed yellow line demarcates the epithelial compartment, which is indicated by *. Scale bars: 100 µm, 10 µm in detail. c Quantification of marker positive stromal cells in different regions of the mammary gland, shown as box plots; the dots indicate single fields of view (FOV), n = 3 biological replicates, N = 68 FOVs for CD39 and 55 FOVs for SCA1. Statistical analysis: Wilcoxon test, two-sided. d Representative FACS plots separating mammary fibroblasts into CD39+; SCA1+ DPP4neg and SCA1 + DPP4+ populations. eg Co-culture of sorted fibroblasts with mammary epithelial organoids. e Representative images of organoids after 5 days of co-culture with FACS-sorted fibroblasts (organoids in cyan, fibroblasts in red). Scale bars: 100 µm. f Quantification of the percentage of budding organoids, shown as box plots. Each dot represents a biological replicate, lines connect paired experiments; n = 3 independent experiments. Statistical analysis: Student’s t-test, two-sided. g Quantification of the number of buds formed per organoid, where each dot represents one organoid, and the dot colours code paired experiments; n = 3 independent experiments, N = 91, 40 and 44 organoids for CD39+, DPP4neg and DPP4+ population, respectively. Statistical analysis: Student’s t-test, two-sided. h–j Adipogenesis assay on sorted fibroblasts. h Representative images of FACS-sorted fibroblasts after 11 days of culture in minimal or complete adipogenic medium in 2D (on plastic) or 3D (in Matrigel). Scale bars: 50 µm. i, j Quantification of adipogenic differentiation in 2D (i) and 3D (j) cultures, shown as box plots. Each dot represents a biological replicate; n = 3 independent experiments. Statistical analysis: Student’s t-test, two-sided.
Fig. 4
Fig. 4. Peri-TEB fibroblasts represent a transient cell state and do not migrate with the branching epithelium.
a Schematic representation of the Acta2-CreERT2;R26-mTmG mouse model. b Lineage tracing strategy for the chase experiments. c, d Flow cytometry quantification of GFP+ cells within total stromal cells (c) and quantification of the proportion of GFP+ fibroblasts in the 3 fibroblast populations detected by FACS (d); n = 3 mice per time-point. Statistical analysis: Wilcoxon, two-sided (c) and chi-square test (d). e, f Projections of z-stack imaging of whole-mount mammary glands 24 h, 1 week or 3 weeks after tamoxifen induction. Red boxes in the whole organ overviews (e) indicate the regions presented in (f) Red boxes in detailed pictures of ductal or peri-TEB regions (f) indicate magnified regions with GFP+ fibroblasts (in insets i–iv). The GFP channel is shown as a “fire” lookup table. White arrowheads indicate GFP+ fibroblasts, orange arrowheads indicate GFP+ adipocytes, empty arrowheads indicate GFP+ mural cells. Scale bars: 1 cm in (e); 100 µm in (f), 50 µm in insets in (f); the images are representative of 3 mice per time-point. g Quantification of the distribution of GFP+ fibroblasts in TEBs or ductal regions after 24 h, 1 week or 3 weeks of chase; n = 3 mice per time-point, N = 38 z-stack for the 24 h chase, 22 z-stacks for 1 week and 51 z-stacks for the 3 weeks chase. Statistical analysis: Wilcoxon test, two-sided. h Quantification of the distance of GFP+ fibroblasts from TEBs. n = 3 mice per time-point, N = 343 fibroblasts for 24 h, 106 for 1 week and 144 for 3 week-chase. Statistical analysis: Wilcoxon test, two-sided.
Fig. 5
Fig. 5. Tracing the fate of peri-TEB fibroblasts.
a Projections of z-stack imaging of whole mammary glands after tamoxifen induction (24 h and 3 weeks chase). White arrowheads indicate GFP+ fibroblasts, orange arrowheads indicate GFP+ adipocytes (expressing perilipin 1, PLIN1), empty arrowheads indicate GFP+ mural cells. White boxes outline areas (fibroblasts and adipocytes) shown in detail. Scale bars: 100 µm in (a), 20 µm in detail. b Quantification of GFP+ adipocytes and fibroblasts after 24 h or 3 weeks of chase; n = 4 mice per time-point, N = 38 z-stack for the 24 h chase—duct (0.123 mm3 in total), 19 z-stacks for 24 h chase—TEB (0.127 mm3 in total), 47 z-stacks for the 3 weeks chase (0.152 mm3 in total), statistical analysis: Student’s t-test, two-sided. c, d In vitro 3D adipogenesis assay on sorted (GFP+ and GFPneg) fibroblasts from Acta2-CreERT2;R26-mTmG mice after 24 h, 3 weeks or 6 weeks of chase. c Schematic outline of the experiment and representative images showing the morphology of sorted GFP+ and GFPneg fibroblasts after the indicated chase times. Cyan shows the lipid dye or GFP in the upper row (GFP+), while tdTomato (in red) delineates the membrane of GFPneg cells in the lower row. Scale bars: 20 µm. d Quantification of GFP+ fibroblast differentiation towards adipocytes; n = 3 independent experiments for 24 h and 3 weeks, and 2 for 6 weeks, statistical analysis: Fisher’s exact test.
Fig. 6
Fig. 6. Peri-TEB fibroblasts are recruited from preadipocytes.
a UMAP plot showing the expression of Fgf10 in the different fibroblast clusters from Fig. 1e. b Detection of Fgf10 expression in distal fat pad and peri-TEB areas using in situ hybridization. The dashed yellow line indicates the TEB border. The yellow boxes demarcate distal fat pad (A) and peri-TEB (B) regions shown in the magnified insets. White arrowheads point to Fgf10+ fat pad fibroblasts, empty arrowheads indicate Fgf10neg peri-TEB fibroblasts. Scale bar: 100 µm and 20 µm in insets. The image is representative of 3 biological replicates. c Schematic representation of the Fgf10-CreERT2;R26-mTmG mouse model. d, e Flow cytometry quantification of GFP+ cells within total stromal cells (d) and quantification of the proportion of GFP+ fibroblasts among the fibroblast populations defined by FACS (e). n = 4 mice per time-point. Statistical analysis: Student’s t-test, two-sided in (d) and chi-square test in (e). f–j. Immunofluorescence analysis of mammary glands from tamoxifen-induced Fgf10-CreERT2;R26-mTmG females after 24 h, 3 days, 1 week or 3 weeks of chase. f Representative images of z-stack projections of mammary gland wholemounts. Scale bar: 100 µm. g, h Quantification of GFP+ fibroblasts in the TEBs and subtending duct regions (the regions are defined in schematics in g), as detected in wholemounts. In the box plots showing quantifications (h), each dot represents the number of GFP+ cells in one FOV. f–h n = 4 independent experiments, N = 15; 12 and 9 TEBs for 24 h, 3 days and 1 week time points, respectively. Statistical analysis: Wilcoxon test, two-sided. i, j Immunofluorescence analysis of mammary gland sections from tamoxifen-induced Fgf10-CreERT2;R26-mTmG females after 24 h, 3 days and 1 week of chase. i Representative images of tissue sections containing TEBs: dashed lines indicate GFP+ fibroblasts, empty arrowheads indicate GFP+ αSMAneg cells and red arrowheads indicate GFP+ αSMA+ cells. Scale bars: 10 µm. j Quantification of the proportion of double positive GFP+ αSMA+ cells among all GFP+ cells, shown as box plots. Each dot indicates the proportion of double positive cells in one FOV; n = 3 independent experiments, N = 12; 3 and 13 FOVs for 24 h, 3 days and 1 week of chase, respectively. Statistical analysis: Wilcoxon test, two-sided.
Fig. 7
Fig. 7. Schematic representation summarizing our findings: peri-TEB fibroblasts are recruited by the growing epithelium from preadipocytes in the fat pad.
A schematic representation of our findings. Upper panel: The mammary stroma comprises 5 clusters of fibroblasts with distinct spatial locations: peri-TEB fibroblasts surround the neck of TEBs, periductal fibroblasts envelope the ducts, interstitial progenitors reside in collagenous fat pad septae, AREGs dwell in blood vessel stroma, and preadipocytes are scattered between adipocytes. Lower panel: Our lineage tracing experiments starting from peri-TEB fibroblasts (with Acta2-CreERT2; in green) or from preadipocytes (with Fgf10-CreERT2; in red) suggest that preadipocytes are recruited by the TEBs and activated into the transient peri-TEB state, then differentiate into periductal fibroblasts and later also into preadipocytes and adipocytes (black arrows).

References

    1. Plikus, M. V. et al. Fibroblasts: origins, definitions, and functions in health and disease. Cell184, 3852–3872 (2021). - PMC - PubMed
    1. Sumbal, J., Belisova, D. & Koledova, Z. Fibroblasts: the grey eminence of mammary gland development. Semin. Cell Dev. Biol.114, 134–142 (2021). - PubMed
    1. Tomasek, J. J., Gabbiani, G., Hinz, B., Chaponnier, C. & Brown, R. A. Myofibroblasts and mechano-regulation of connective tissue remodelling. Nat. Rev. Mol. Cell Biol.3, 349–363 (2002). - PubMed
    1. Buechler, M. B. et al. Cross-tissue organization of the fibroblast lineage. Nature593, 575–579 (2021). - PubMed
    1. Muhl, L. et al. Single-cell analysis uncovers fibroblast heterogeneity and criteria for fibroblast and mural cell identification and discrimination. Nat. Commun.11, 3953 (2020). - PMC - PubMed

MeSH terms

LinkOut - more resources